 E-submission
 TOTA
TOTA TOTS
TOTS
Articles
- Page Path
- HOME > J Musculoskelet Trauma > Volume 39(1); 2026 > Article
-
Original Article
- Computed tomography plane reformatting to reduce projection error in measuring Pauwels angle of femoral neck fractures: a cross-sectional study
-
Gyu Min Kong1
 , Jae-Young Lim1, Se-Lin Jeong2, Gu-Hee Jung2,3
 -
Journal of Musculoskeletal Trauma 2026;39(1):38-47.
DOI: https://doi.org/10.12671/jmt.2025.00038
Published online: January 25, 2026
1Department of Orthopedic Surgery, Inje University Haeundae Paik Hospital, Busan, Korea
2Department of Orthopedic Surgery, Gyeongsang National University Changwon Hospital, Gyeongsang National University College of Medicine, Changwon, Korea
3Medical ICT Convergence Research Center, Institute of Health Sciences, Gyeongsang National University College of Medicine, Jinju, Korea
- Correspondence to: Gu-Hee Jung Department of Orthopedic Surgery, Gyeongsang National University Changwon Hospital, 11 Samjeongja-ro, Seongsan-gu, Changwon 51472, Korea Tel: +82-55-214-3822 Email: jyujin2001@hotmail.com
• Received: January 3, 2025 • Revised: October 22, 2025 • Accepted: October 22, 2025
© 2026 The Korean Orthopaedic Trauma Association
This is an Open Access article distributed under the terms of the Creative Commons Attribution Non-Commercial License (http://creativecommons.org/licenses/by-nc/4.0/) which permits unrestricted noncommercial use, distribution, and reproduction in any medium, provided the original work is properly cited.
- 626 Views
- 13 Download
Abstract
-
Objectives This study aimed to assess fracture verticality in both coronal and axial planes after eliminating projection error in femoral neck fractures among non-older adults, and to demonstrate its clinical utility using computed tomography (CT)-based modeling at actual size.
-
Methods This retrospective observational study enrolled 57 patients (30 males and 27 females), aged 20–65 years, with displaced femoral neck fractures. Based on CT images, an actual-size fracture model was constructed. The CT scanning plane was reformatted with the neck-shaft fragment realigned vertically to the ground and parallel to the femoral neck axis. Three consecutive images were used to generate coronal reformats at the centerline and posterior border to measure central and posterior coronal plane verticality as Pauwels angle (PA). The central image of the reformatted axial plane was used to assess axial plane verticality. Differences in verticality were analyzed using analysis of variance.
-
Results Three coronal morphology types were identified: linear (n=30), concave (n=25), and convex (n=2). Two axial morphology types were observed: cephalad (n=35) and trochanteric (n=22). The mean central PA, posterior PA, and axial verticality were 55.43°±13.79°, 51.44°±11.13°, and 85.70°±18.42, respectively. Only the central PA showed a significant difference (P<0.001). The PA was significantly higher in the linear coronal type between images (P<0.05) and in the trochanteric axial type (P<0.05).
-
Conclusions After reformatting the scanning plane, the central PA showed significant variation between images. Femoral neck fractures of the linear type in the coronal plane and the trochanteric type in the axial plane demonstrated greater verticality than other morphological types.
- Level of evidence: III.
Introduction
Femoral neck fractures can be classified based on coronal verticality of fracture orientation and biomechanical properties as originally described by Pauwels in 1935 [1,2]. It is well known that vertically oriented femoral neck fracture (Pauwels' type III) should be distinguished since this fracture causes high-shear force and consequently there was a high rate of fixation problems, including nonunion and fixation failure [3-5]. Vertical neck fractures in non-older adults should be especially distinguished because different fixation strategies must be applied to optimize postoperative stability of the bone-implant interfaces against a high-shear force [6-10]. Considering that fracture types are originally dependent on coronal verticality (Pauwels angle, PA), PA measurement based on an exact method with a clear consensus is a prerequisite for classifying fractures and choosing optimal fixation constructs [7,8,11].
A previous study [11] has demonstrated that PAs are significantly different between the two measurement methods according to the computed tomography (CT) scanning plane. In the reformatted CT scan plane along the neck centerline to eliminate projection error, PAs increased in all cases, and showing a mean difference of 15.7° [11]. However, one of the shortcomings is that we used only one reformatted coronal image to measure the PA. Consequently, there was no morphologic consideration of isolated high-shear angle fractures, which had significant neck comminution (96%), located mainly in inferior and posterior quadrants in young adults [12]. Here, a clinical CT-based model of femoral neck fracture in non-older adults was developed to measure fracture verticality without projection angle through synchronized windows composed of images from the axial, coronal and sagittal planes.
The primary objectives of this CT-based clinical study were (1) to assess the verticality of fracture in the reformatted coronal and axial planes without projection error; (2) to evaluate morphological features of femoral neck fracture; and (3) to introduce practical implications by analyzing the correlations.
Methods
This study was approved by the Institutional Review Board (IRB) of Gyeongsang National University Changwon Hospital (IRB No. GNUCH 2019-04-014), and the requirement for informed consent was waived because it involved the retrospective analysis of the medical records and radiographs.
It is a cross-sectional study.
The study was performed at the Gyeongsang National University Changwon Hospital, in Changwon, Korea. Eligible cases were identified from the institutional electronic medical record (EMR) and picture archiving and communication system (PACS) between January 1, 2020 to December 31, 2020.
By reviewing the medical histories and radiographs obtained at the time of injury, a total of 153 patients with femoral neck fractures were screened, of whom 57 were finally enrolled. Patients were eligible if they were aged 20–65 years, had an acute femoral neck fracture confirmed on radiography/CT, and had preoperative CT available in Digital Imaging and Communications in Medicine (DICOM) format with slice thickness 2 or 3 mm. This study excluded patients over 65 years of age, those with concomitant lower extremity injuries (e.g., femur shaft fracture, femoral head dislocation and tibial fractures), patients with pathological fractures, and patients who had previously undergone surgical treatment of the same hip joint. Base fracture of the femoral neck (basicervical fracture) was also excluded through the closed radiographic review [13]. Finally, 57 patients (30 males and 27 females) were enrolled, and the mean age of the patients enrolled was 47.3±11.3 years old.
The primary outcome variable was a difference in central coronal verticality (central PA) across three consecutive central coronal images after standardized reformatting. Secondary outcome variables included differences between posterior coronal images (posterior PA) and axial images (axial verticality), and associations between verticality and morphology types.
CT data of slices with a thickness of 2 or 3 mm in the format of DICOM were imported into Materialise Interactive Medical Image Control System (Mimics) software (Materialise) to reconstruct the femoral neck fracture model (fracture model) at actual size, which could be synchronized in coronal, sagittal and axial planes. To make consistent measurements and eliminate projection error, we applied the following steps using tools of Mimics software [11,14]: (1) The proximal femur was selected as a cropping area, the scanning plane was reformatted parallel to the neck midline of the neck-shaft fragment in the axial plane, and the proximal femur was realigned vertically to the ground in the coronal plane (Fig. 1). (2) To measure the coronal verticality, we selected three consecutive images from the neck midline to the posterior direction (central verticality [central PA]) and three consecutive images from the posterior border to the anterior direction (posterior verticality [posterior PA]) as coronal reformatted images. (3) The coronal PA of six coronal reformatted images was measured using the centerline of the proximal shaft (Y-axis) and the ground line (X-axis) as a constant guideline [15]. Among them, the greatest value was determined as maximum (max) central and max posterior PA (Fig. 2A). (4) For the axial verticality, the scanning plane was reoriented again parallel to the neck axis of the neck-shaft fragment both in axial and coronal plane (Fig. 2B). (5) We selected three consecutive images from center to inferior as the axial reformatted images. The axial verticality was defined as the angle between the centerline of femoral neck and the imaginary line between the anterior and posterior ends of the fracture. The greatest value was determined as the max axial verticality (Fig. 2B).
In the reformatted coronal images, the coronal PA was used to classify three types of Pauwels' (type I <30°, type II, 30°–50°, and III >50°). Based on the fracture line, the coronal morphology (coronal type) was divided into three types of linear, convex, and concave type (Fig. 3A). Concerning the axial morphology (axial type), if the angle of axial verticality was less than 90°, it was a cephalad type, and if it was more than 90°, it was a trochanteric type (Fig. 3B).
We attempted to reduce selection bias by including consecutive eligible patients with available CT during the study period. Residual bias may exist because CT acquisition may reflect local practice patterns and injury severity. Measurement bias was addressed by standardized CT plane reformatting and use of fixed reference axes; remaining bias may arise from manual landmark placement and fracture comminution.
The study size was determined by the number of eligible cases available during the predefined study period (n=57 included). Because this was a retrospective study, no prospective sample-size calculation was performed; the analysis was intended to estimate differences in within-fracture measurements and their associated precision.
For ordinary scales, statistical evaluation was performed using the chi-square test. Continuous data from consecutive images were analyzed using repeated-measures analysis of variance followed by Bonferroni’s post hoc test. Statistical significance was considered when the P-value was less than 0.05. The IBM SPSS ver. 29.0 (IBM Corp.) was used for all statistical analyses. There were no missing imaging outcomes.
Results
All results of coronal and axial verticality are summarized in Table 1. Central PA values were 55.43°±13.79°, 53.40°±13.69°, and 53.08°±13.09° and posterior PA values were 51.44°±11.13°, 50.91°±11.75°, and 50.00°±11.42° for three consecutive images. The max central PA had a mean value of 56.42° (range, 30.1°‒85.0°; SD, 13.46°) and the max posterior PA, 53.47° (range, 34.6°‒79.2°; SD, 10.68°). The axial verticality values of three consecutive images were 85.70°±18.42°, 85.85°±18.55°, and 85.85°±19.23°, respectively (Fig. 4). The max axial verticality had a mean value of 87.64° (range, 44.5°‒137.1°; SD 18.78°). Concerning the normality test, all coronal and axial verticality variables were satisfied (P>0.05). When comparing the max central and posterior PA, their mean difference was 2.94°±10.11°, which was statistically significant (P=0.032). The mean central PA differed statistically significantly among the three central images (F=8.796, P<0.001). The central PA decreased statistically significantly from the 1st central image to the 2nd image (2.033° [95% CI, 0.69‒3.38], P<0.001), and from the 1st central image to the 3rd image (2.353° [95% CI, 0.69‒4.02], P=0.003), but not from the 2nd image to the 3rd image (0.32° [95% CI, ‒1.16 to 1.79], P=1.000). The mean posterior PA was not significantly different among the three posterior images. An axial verticality was not significantly different (Table 1).
Concerning the fracture morphology in the coronal plane, it was a linear type for 30 cases (52.6%), a concave type for 25 cases (43.9%), and a convex type for two cases (3.5%). In the axial plane, there were 35 cases (61.4%) of the cephalad type and 22 cases (38.6%) of the trochanter type. Based on the max central PA, Pauwels' type II had 15 cases and Pauwels' type III, 39 cases. For the max posterior PA, Pauwels' type II had 22 cases, and Pauwels' type III 35 cases.
Depending on the fracture type, all results are summarized in Table 2. Concerning the correlation of PA and coronal type (55 cases, except two cases of convex type), the only central PA differed significantly between images (F (2,11)=9.541; P<0.001) (Fig. 5). Concerning the coronal morphology, all verticality angles of the linear type were significantly higher in six coronal images and three axial images. For axial type, the central PA differed significantly between images (F (2.11)=10.116; P<0.001). However, the posterior PA was not significantly different (P=0.112). The coronal PA of the trochanteric type was significantly higher (P<0.001).
Considering differences in verticality angle between reformatted images, fractures with a linear type in the coronal plane and trochanteric type in the axial plane were stratified as a high verticality group, and 11 femurs were included. The central PA of the high verticality group had a mean value of 58.07°±3.18°. For others, the mean was 52.22°±2.07°. The posterior PA of the high verticality group had a mean value of 52.54°±2.70°, and those of others had a mean value of 50.04°±1.76°. Only central PA differed significantly between groups (F (2,11)=10.472; P<0.001) (Table 3).
Discussion
Although Pauwels biomechanical classification is in use nowadays, practical measurement of coronal verticality had lower reliability in preoperative radiographs due to projection errors and leg deformity during radiographic examination [11,16,17]. Considering that femoral neck fractures in non-older adults inevitably have significant displacement and comminution of fracture site, the conventional method to measure the PA is technically difficult in practice. Thus, we performed verticality measurements in multiple sites based on a previous study [11]. Through this imaging study, we would introduce how to apply Pauwels classification in practice after eliminating projection error of comminuted neck fracture in non-older adults. By using the software to allow free 360° rotations with magnification in any plane, this study has several interesting and practical findings. First, among six coronal images, the centerline image had the highest value of coronal PA. The coronal PA of the 1st central image was a mean value of 55.43°±13.79° and the 1st posterior images, mean value of 51.44°±11.13 (P=0.003). Second, CT scanning planes along the centerline of the femoral neck in coronal and axial planes could be used to measure the maximal fracture verticality without specialized software or equipment (Fig. 6). Third, fractures of the linear type in the coronal plane and trochanteric type in the axial type had higher verticality than other types. Thus, they were classified into the high verticality group.
Regarding verticality measurement using CT images instead of plain radiographs, choosing the right image is essential. Compared with posterior coronal images, central images had greater PA in most cases. Our study demonstrates that the most central reformatted coronal image (centerline images) is the best for measuring the max PA. According to Collinge et al. [12], vertical femoral neck fractures had the major comminution and mostly located in the inferior and posterior quadrants. Thus, the PA was inevitably greater in centerline images, similar to our study results. Furthermore, all PA of linear-type fractures were significantly higher in six coronal images and three axial images. For axial morphology, the PA of the trochanteric type was significantly higher in central coronal images. Based on our results, neck fracture of linear type in the coronal and trochanteric type in the axial plane could be classified into the high verticality group. Ideal images for measuring the PA are the centerline image in the coronal and axial plane. If the CT scanning plane is simply reformatted parallel to the neck midline of the neck-shaft fragment in the axial plane, centerline images will be readily available for measuring the PA without additional devices or support. Our simple and convenient method of reformatting the CT scan plane could be used for eliminating projection errors and accurately assessing the fracture morphology and PA.
Concerning the high risk of most vertical fractures leading to nonunion, fixation failure, and osteonecrosis, as already well known, they should be discriminated against to differentiate the fixation strategy [4,18,19]. However, although the practical measurement of PA had lower reliability, most vertical fractures were classified as Pauwels' type III and vertically oriented fractures. As mentioned above, the reformatted CT scan plane along the neck centerline could eliminate the projection error, and thus, the PAs were increased significantly [11]. Through the results of this study, the simple and convenient method of reformatting the CT scan plane, surgeons could stratify the high verticality group based on the fracture morphology and PA, which should be measured in the centerline image of the neck-shaft fragment. The femoral neck fracture of linear type in the coronal plane and trochanteric type in axial type is a higher verticality group.
Despite our interesting findings, our computational measurement had several limitations. First, since the PA was measured manually using tools in Mimics software, there might be slight errors in measurement. Second, given the small sample size with only 57 enrolled fractures, our results might not be generalized. Third, clinical significance of the verticality difference according to the measurement method could not adequately be demonstrated because postoperative follow-up outcomes were not evaluated, and the clinical impact on surgical decision-making or fixation strategy was also unknown. However, our study’s contribution lies in validating a widely used approach rather than proposing a novel method for measuring the PA (fracture verticality). After reformatting the CT scanning plane, the centerline coronal and axial images should be utilized to measure the PA and fracture verticality. Our CT scanning reformatted technique and findings allow us to easily differentiate a high verticality group from a neck fracture in non-older adults. This will help orthopedic surgeons decide on the best implants and anticipate clinical problems of fracture healing.
If the CT scanning plane is reformatted to be parallel to the neck and vertical to the ground, these images would be useful for eliminating projection errors and accurately assessing fracture morphology and verticality. Because central coronal and axial images had the highest PA, coronal and axial verticality should be measured in the centerline of the femoral neck. Concerning morphologic features, neck fractures of linear and trochanteric type had the highest angles. Thus, they were classified into the high verticality group. Our simple and convenient method of reformatting the CT scan plane is readily available to most surgeons without additional devices or support.
-
Author contributions
Methodology: JYL. Investigation: JYL, SLJ. Visualization: GHJ. Writing-original draft: GHJ. Writing-review & editing: GMK, JYL, SLJ, GHJ. All authors read and approved the final manuscript.
-
Conflicts of interest
No potential conflict of interest relevant to this article was reported.
-
Funding
None.
-
Data availability
Contact the corresponding author for data availability.
-
Acknowledgments
None.
-
Supplementary materials
None.
Article Information
Fig. 1.

After the proximal femur was selected as a cropping area, the scanning plane was reformatted parallel to the neck midline of the neck-shaft fragment in the axial plane. The proximal femur was then realigned vertically to the ground in the coronal plane using tools of Mimics software. Then, fracture morphologies were assessed in coronal (A), axial (B), sagittal (C), and three-dimensional biplanar plane (D).
Fig. 2.

To make consistent measurements and eliminate projection error, after the computed tomography scan plane was reformatted to an axial plane parallel to the femoral neck axis, red lines were placed anterior and posterior to the neck cortex in the axial (A) and coronal (B) planes. The yellow lines were placed in the centerline and posterior cortex (C). Then, (D) the coronal Pauwels angle (PA) was measured between the red line (ground line) and the blue line (reformatted fracture angle) in three consecutive images of the coronal plane. (E) The red line marked the anterior and posterior cortex in the axial and coronal planes. (F) The yellow lines were placed along the centerline of the neck, and three consecutive images of the axial plane were chosen. Then, (G) The axial PA was measured between the red line (ground line) and the blue line (reformatted fracture angle).
Fig. 3.

(A) In the reformatted coronal images, fractures were classified into three morphological types—linear, convex, and concave—based on the fracture line. (B) Axial verticality was classified according to the measured angle: fractures with an angle <90° were defined as the cephalad type, and those with an angle ≥90° as the trochanteric type.
Fig. 4.

Measured values of (A) central coronal verticality, (B) posterior coronal verticality, and (C) axial verticality demonstrating inter-image differences.
Fig. 5.

The central coronal PAs were compared for linear vs concave fracture types (A) and cephalad vs trochanter types (B). The posterior coronal PAs were compared for linear vs. concave types (C) and cephalad vs. trochanter type (D). Axial verticality was compared between linear and concave types (E). Two-way repeated-measures analysis of variance showed that the only central coronal verticality differed significantly between images.
Fig. 6.

A 38-year-old male patient presented with hip pain following a 3 m fall. (A) The initial plain radiograph revealed a femoral neck fracture. (B, C) The computed tomography (CT) plane parallel to the femoral neck centerline identified a convex fracture with a Pauwels angle of 45.1° in the coronal plane. (D, E) Reorientation of the CT plane along the femoral neck demonstrated a cephalad-type fracture with an axial verticality of 75.8° in the axial plane.
Table 1.
Overall characteristics and comparison of verticality
Table 2.
Overall results of Pauwels’ classification and comparison of verticality and fracture types
Table 3.
Overall characteristics and comparison between the high verticality group and others
| Verticality | Consecutive image | RM-ANOVA | Pairwise comparison | |||
|---|---|---|---|---|---|---|
| High verticalitya) | Others | F-ratio | P-value | Mean difference | P-value | |
| C-Co (°) | 58.07±3.18 | 52.22±2.07 | 10.47 | <0.001 | 5.849±3.794 | 0.129 |
| P-Co (°) | 52.54±2.70 | 50.04±1.76 | ** | 0.230 | 2.493±3.219 | 0.442 |
- 1. Shen M, Wang C, Chen H, Rui YF, Zhao S. An update on the Pauwels classification. J Orthop Surg Res 2016;11:161.ArticlePubMedPMCPDF
- 2. Parker MJ, Dynan Y. Is Pauwels classification still valid. Injury 1998;29:521-3.ArticlePubMed
- 3. Enocson A, Lapidus LJ. The vertical hip fracture: a treatment challenge: a cohort study with an up to 9 year follow-up of 137 consecutive hips treated with sliding hip screw and antirotation screw. BMC Musculoskelet Disord 2012;13:171.ArticlePubMedPMCPDF
- 4. Liporace F, Gaines R, Collinge C, Haidukewych GJ. Results of internal fixation of Pauwels type-3 vertical femoral neck fractures. J Bone Joint Surg Am 2008;90:1654-9.ArticlePubMed
- 5. Parker MJ. Results of internal fixation of Pauwels type-3 vertical femoral neck fractures. J Bone Joint Surg Am 2009;91:490-1.
- 6. van Embden D, Roukema GR, Rhemrev SJ, Genelin F, Meylaerts SA. The Pauwels classification for intracapsular hip fractures: is it reliable. Injury 2011;42:1238-40.ArticlePubMed
- 7. Johnson JP, Borenstein TR, Waryasz GR, et al. Vertically oriented femoral neck fractures: a biomechanical comparison of 3 fixation constructs. J Orthop Trauma 2017;31:363-8.ArticlePubMedPMC
- 8. Aminian A, Gao F, Fedoriw WW, Zhang LQ, Kalainov DM, Merk BR. Vertically oriented femoral neck fractures: mechanical analysis of four fixation techniques. J Orthop Trauma 2007;21:544-8.ArticlePubMed
- 9. Luttrell K, Beltran M, Collinge CA. Preoperative decision making in the treatment of high-angle “vertical” femoral neck fractures in young adult patients: an expert opinion survey of the Orthopaedic Trauma Association’s (OTA) membership. J Orthop Trauma 2014;28:e221-5.ArticlePubMed
- 10. Fixation using Alternative Implants for the Treatment of Hip fractures (FAITH) Investigators. Fracture fixation in the operative management of hip fractures (FAITH): an international, multicentre, randomised controlled trial. Lancet 2017;389:1519-27.ArticlePubMedPMC
- 11. Kong GM, Kwak JM, Jung GH. Eliminating projection error of measuring Pauwels’ angle in the femur neck fractures by CT plane manipulation. Orthop Traumatol Surg Res 2020;106:607-11.ArticlePubMed
- 12. Collinge CA, Mir H, Reddix R. Fracture morphology of high shear angle “vertical” femoral neck fractures in young adult patients. J Orthop Trauma 2014;28:270-5.ArticlePubMed
- 13. Watson ST, Schaller TM, Tanner SL, Adams JD, Jeray KJ. Outcomes of low-energy basicervical proximal femoral fractures treated with cephalomedullary fixation. J Bone Joint Surg Am 2016;98:1097-102.ArticlePubMed
- 14. Chung HJ, Park J, Sohn HS, Jung GH. The usefulness of reformatting CT scanning plane to distinguish sacral dysmorphism and introducing the variable of elevated height for predicting the possibility of trans-sacral screw fixation. Orthop Traumatol Surg Res 2020;106:109-15.ArticlePubMed
- 15. Wang SH, Yang JJ, Shen HC, Lin LC, Lee MS, Pan RY. Using a modified Pauwels method to predict the outcome of femoral neck fracture in relatively young patients. Injury 2015;46:1969-74.ArticlePubMed
- 16. Bartonícek J. Pauwels’ classification of femoral neck fractures: correct interpretation of the original. J Orthop Trauma 2001;15:358-60.ArticlePubMed
- 17. Zhang YL, Zhang W, Zhang CQ. A new angle and its relationship with early fixation failure of femoral neck fractures treated with three cannulated compression screws. Orthop Traumatol Surg Res 2017;103:229-34.ArticlePubMed
- 18. Ye Y, Chen K, Tian K, Li W, Mauffrey C, Hak DJ. Medial buttress plate augmentation of cannulated screw fixation in vertically unstable femoral neck fractures: surgical technique and preliminary results. Injury 2017;48:2189-93.ArticlePubMed
- 19. Ly TV, Swiontkowski MF. Treatment of femoral neck fractures in young adults. J Bone Joint Surg Am 2008;90:2254-66.PubMed
References
Figure & Data
REFERENCES
Citations
Citations to this article as recorded by 
 ePub Link
 Cite
CiteComputed tomography plane reformatting to reduce projection error in measuring Pauwels angle of femoral neck fractures: a cross-sectional study
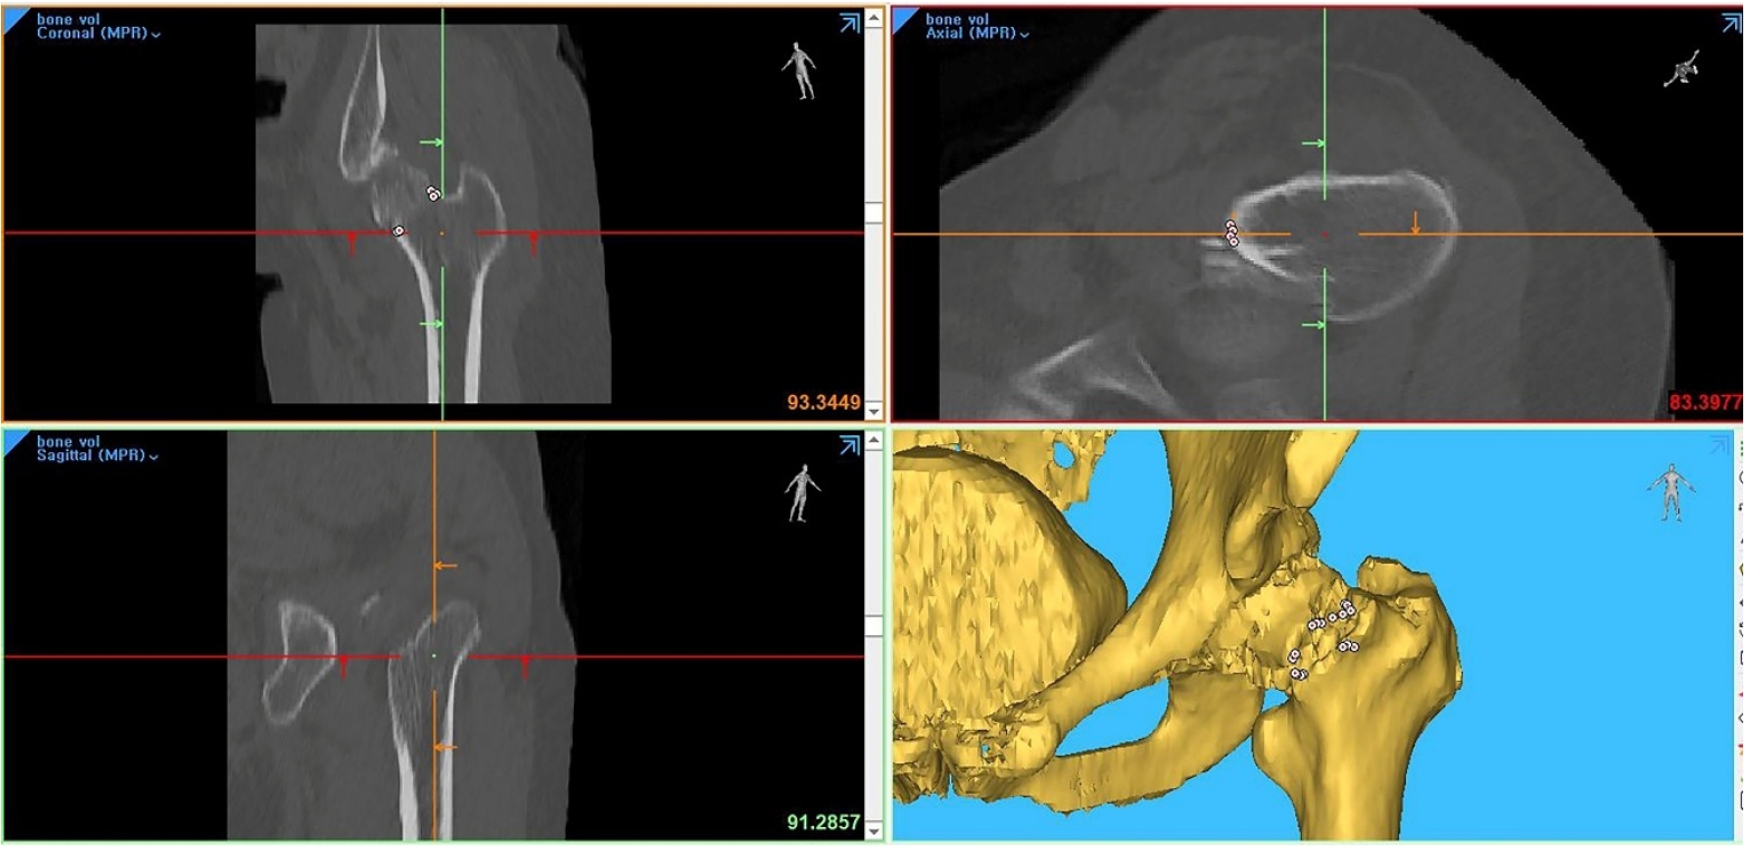


Fig. 1. After the proximal femur was selected as a cropping area, the scanning plane was reformatted parallel to the neck midline of the neck-shaft fragment in the axial plane. The proximal femur was then realigned vertically to the ground in the coronal plane using tools of Mimics software. Then, fracture morphologies were assessed in coronal (A), axial (B), sagittal (C), and three-dimensional biplanar plane (D).
Fig. 2. To make consistent measurements and eliminate projection error, after the computed tomography scan plane was reformatted to an axial plane parallel to the femoral neck axis, red lines were placed anterior and posterior to the neck cortex in the axial (A) and coronal (B) planes. The yellow lines were placed in the centerline and posterior cortex (C). Then, (D) the coronal Pauwels angle (PA) was measured between the red line (ground line) and the blue line (reformatted fracture angle) in three consecutive images of the coronal plane. (E) The red line marked the anterior and posterior cortex in the axial and coronal planes. (F) The yellow lines were placed along the centerline of the neck, and three consecutive images of the axial plane were chosen. Then, (G) The axial PA was measured between the red line (ground line) and the blue line (reformatted fracture angle).
Fig. 3. (A) In the reformatted coronal images, fractures were classified into three morphological types—linear, convex, and concave—based on the fracture line. (B) Axial verticality was classified according to the measured angle: fractures with an angle <90° were defined as the cephalad type, and those with an angle ≥90° as the trochanteric type.
Fig. 4. Measured values of (A) central coronal verticality, (B) posterior coronal verticality, and (C) axial verticality demonstrating inter-image differences.
Fig. 5. The central coronal PAs were compared for linear vs concave fracture types (A) and cephalad vs trochanter types (B). The posterior coronal PAs were compared for linear vs. concave types (C) and cephalad vs. trochanter type (D). Axial verticality was compared between linear and concave types (E). Two-way repeated-measures analysis of variance showed that the only central coronal verticality differed significantly between images.
Fig. 6. A 38-year-old male patient presented with hip pain following a 3 m fall. (A) The initial plain radiograph revealed a femoral neck fracture. (B, C) The computed tomography (CT) plane parallel to the femoral neck centerline identified a convex fracture with a Pauwels angle of 45.1° in the coronal plane. (D, E) Reorientation of the CT plane along the femoral neck demonstrated a cephalad-type fracture with an axial verticality of 75.8° in the axial plane.
Fig. 1.
Fig. 2.
Fig. 3.
Fig. 4.
Fig. 5.
Fig. 6.
Computed tomography plane reformatting to reduce projection error in measuring Pauwels angle of femoral neck fractures: a cross-sectional study
| Verticality | Consecutive image | RM-ANOVA | Pairwise comparison | |||||
|---|---|---|---|---|---|---|---|---|
| 1st | 2nd | 3rd | F-ratio | P-value | Image | Mean difference | P-value | |
| C-Co (°) | 55.43±13.79 | 53.40±13.69 | 53.08±13.09 | 8.796 | <0.001 | 1st vs. 2nd | 2.033±0.546 | 0.001 |
| - | - | - | - | - | 1st vs. 3rd | 2.353±0.675 | 0.003 | |
| - | - | - | - | - | 2nd vs. 3rd | 0.319±0.597 | 1.000 | |
| P-Co (°) | 51.44±11.13 | 50.91±11.75 | 50.00±11.42 | 2.484 | 0.088 | 1st vs. 2nd | 0.528±0.568 | 1.000 |
| - | - | - | - | - | 1st vs. 3rd | 1.435±0.815 | 0.252 | |
| - | - | - | - | - | 2nd vs. 3rd | 0.907±0.534 | 0.285 | |
| Ax (°) | 85.70±18.42 | 85.85±18.55 | 85.85±19.23 | 0.069 | 0.933 | 1st vs. 2nd | ‒0.151±0.326 | 1.000 |
| - | - | - | - | - | 1st vs. 3rd | 0.151±0.326 | 1.000 | |
| - | - | - | - | - | 2nd vs. 3rd | ‒0.002±0.433 | 1.000 | |
| Fracture type | Image of central coronal verticality | Image of posterior coronal verticality | Axial image | |||||||||
|---|---|---|---|---|---|---|---|---|---|---|---|---|
| 1st | 2nd | 3rd | P-value | 1st | 2nd | 3rd | P-value | 1st | 2nd | 3rd | P-value | |
| Pauwels I | 1 | 1 | 1 | 1 | ||||||||
| Pauwels II | 18 | 24 | 28 | 28 | 29 | 24 | ||||||
| Pauwels III | 38 | 32 | 29 | 29 | 27 | 32 | ||||||
| Linear | 59.18±14.03 | 56.61±14.46 | 56.37±13.54 | <0.01 | 54.23±11.03 | 54.01±10.74 | 53.36±10.17 | 0.05 | 92.09±17.89 | 92.54±18.18 | 92.38±19.50 | 0.945 |
| Concave | 51.48±12.96 | 49.72±12.43 | 49.15±12.20 | 48.52±11.01 | 47.58±12.53 | 45.95±12.18 | 79.00±17.06 | 78.71±16.73 | 78.86±16.85 | |||
| Cephalad | 52.32±11.53 | 50.82±11.85 | 50.81±11.08 | <0.01 | 50.24±10.58 | 50.04±11.79 | 48.91±11.23 | 0.11 | ||||
| Trochanter | 60.38±15.81 | 57.50±15.61 | 56.69±15.37 | 53.36±11.97 | 52.31±11.81 | 51.74±11.77 | ||||||
| Verticality | Consecutive image | RM-ANOVA | Pairwise comparison | |||
|---|---|---|---|---|---|---|
| High verticality |
Others | F-ratio | P-value | Mean difference | P-value | |
| C-Co (°) | 58.07±3.18 | 52.22±2.07 | 10.47 | <0.001 | 5.849±3.794 | 0.129 |
| P-Co (°) | 52.54±2.70 | 50.04±1.76 | ** | 0.230 | 2.493±3.219 | 0.442 |
Table 1. Overall characteristics and comparison of verticality
Values are presented as mean±standard deviation. RM-ANOVA, repeated-measures analysis of variance; C-Co, central coronal verticality (central PA); P-Co, posterior coronal verticality (posterior PA); Ax, axial verticality; PA, Pauwels angle.
Table 2. Overall results of Pauwels’ classification and comparison of verticality and fracture types
Values are presented as mean±standard deviation.
Table 3. Overall characteristics and comparison between the high verticality group and others
C-Co, central coronal verticality (central PA); P-Co, posterior coronal verticality (posterior PA); PA, Pauwels’ angle; RM-ANOVA, repeated-measures analysis of variance; High verticality group of linear and trochanter type.

