 E-submission
 TOTA
TOTA TOTS
TOTS
Articles
- Page Path
- HOME > J Musculoskelet Trauma > Volume 28(2); 2015 > Article
-
Original Article
- Progression of Compression and Related Factors in Conservative Management of Osteoporotic Vertebral Compression Fractures
- Young Do Koh, M.D., PhD., Jeong Soo Park, M.D.
-
Journal of the Korean Fracture Society 2015;28(2):132-138.
DOI: https://doi.org/10.12671/jkfs.2015.28.2.132
Published online: April 21, 2015
Department of Orthopaedic Surgery, Ewha Womans University School of Medicine, Seoul, Korea.
- Address reprint requests to: Young Do Koh, M.D. Department of Orthopaedic Surgery, Ewha Womans University Mokdong Hospital, 1071 Anyangcheon-ro, Yangcheon-gu, Seoul 158-710, Korea. Tel: 82-2-2650-5564, Fax: 82-2-2642-0349, ydkoh@ewha.ac.kr
• Received: December 30, 2014 • Revised: February 21, 2015 • Accepted: April 1, 2015
Copyright © 2015 The Korean Fracture Society. All rights reserved.
This is an Open Access article distributed under the terms of the Creative Commons Attribution Non-Commercial License (http://creativecommons.org/licenses/by-nc/3.0/) which permits unrestricted non-commercial use, distribution, and reproduction in any medium, provided the original work is properly cited.
- 1,927 Views
- 7 Download
- 6 Crossref
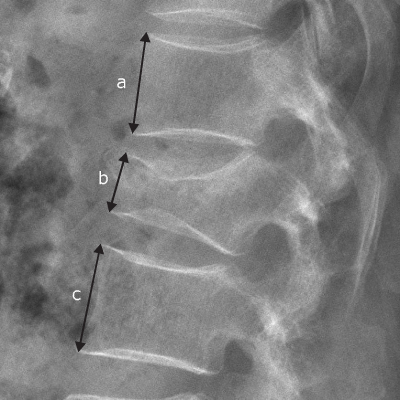
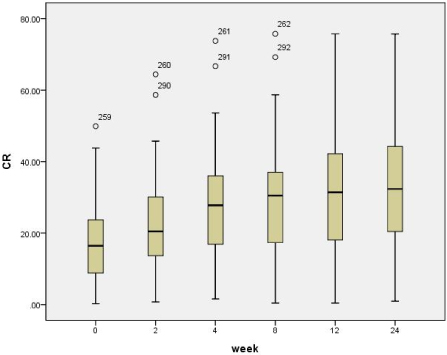
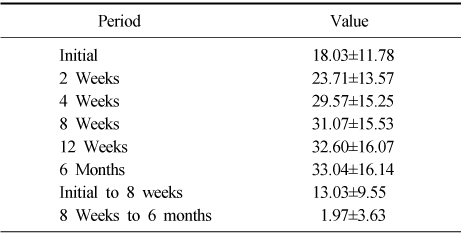

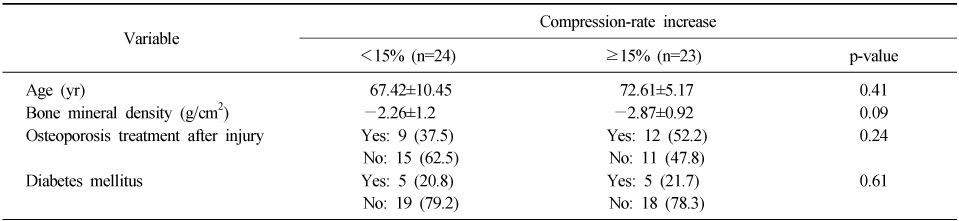
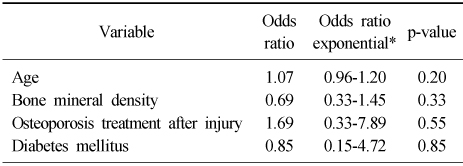
Figure & Data
REFERENCES
Citations
Citations to this article as recorded by 
- Effects of paraspinal muscle atrophy and fatty degeneration on segmental kyphosis after conservative treatment of osteoporotic vertebral compression fracture (OVCF) in postmenopausal women
Inwook Seo, Minjoon Cho, Taehoon Kang, Sungtaek Chung, Jae Hyup Lee
European Spine Journal.2025;[Epub] CrossRef - The Factors between the Progression of the Compression Rate and Magnetic Resonance Imaging Findings in Osteoporotic Vertebral Fracture Patients Treated with Teriparatide
Taebyeong Kang, Seung-Pyo Suh, Jeongwoon Han, Byungjun Kang, Changhyun Park
Journal of the Korean Orthopaedic Association.2023; 58(5): 392. CrossRef - Effect of Weekly Teriparatide Administration Followed by Percutaneous Balloon Kyphoplasty on Post-Menopausal Osteoporotic Compression Fracture Treatment
Sung-Ha Hong, Seung-Pyo Suh, Woo Jin Shin, Seung Gi Lee, Byung Jun Kang
Journal of the Korean Orthopaedic Association.2022; 57(1): 35. CrossRef - Treatment Effect with Weekly Teriparatide in the Vertebral Compression Fractures in Patients with Severe Osteoporosis
Seok-Ha Hwang, Young-Kyun Woo, Ho-Seung Jeon, Seung-Pyo Suh, Joo-Young Kim, Jae-Nam Kim
Journal of the Korean Orthopaedic Association.2019; 54(6): 528. CrossRef - The Influence of Initial Magnetic Resonance Imaging Findings on the Compression Rate of Thoracolumbar Osteoporotic Vertebral Compression Fracture
Seok-Ha Hwang, Seung-Pyo Suh, Young-Kyun Woo, Ho-Seung Jeon, Ho-Won Jeong
Journal of the Korean Orthopaedic Association.2018; 53(4): 341. CrossRef - A Retrospective Clinical Survey of Vertebral Compression Fractures
Ji Hye Oh, Yun Kyu Lee, Jae Soo Kim, Hyun Jong Lee, Sung Chul Lim
Journal of Acupuncture Research.2018; 35(4): 219. CrossRef
 Cite
CiteProgression of Compression and Related Factors in Conservative Management of Osteoporotic Vertebral Compression Fractures


Fig. 1
Method for calculation of compression rate. a, c: anterior vertebral body height of upper and lower vertebra, b: anterior vertebral body height of fractured vertebra.
Fig. 2
Compression rate (CR) (%) according to the serial follow-up.
Fig. 1
Fig. 2
Progression of Compression and Related Factors in Conservative Management of Osteoporotic Vertebral Compression Fractures
Compression Rate (%) according to the Serial Follow-Up and Compression-Rate Progression on Initial to 8 Weeks and 8 Weeks to 6 Months (n=47)
Values are presented as mean±standard deviation.
Difference of Compression-Rate Increase and Change of Mean Slopes between Initial to 8 Weeks and 8 Weeks to 6 Months
p-value=0.00. *Mean±tandard devation. †Corresponding value±standard error.
Single Variable Analysis to Evaluate the Differences of Related Factors between Two Groups*
Values are presented as mean±standard deviation or number (%). *Compression-rate increase: below 15% group and more than 15% group.
Logistic Regression Analysis to Evaluate the Influence of Related Factors on the Compression-Rate Increases
*95% confidence interval.
Table 1
Compression Rate (%) according to the Serial Follow-Up and Compression-Rate Progression on Initial to 8 Weeks and 8 Weeks to 6 Months (n=47)
Values are presented as mean±standard deviation.
Table 2
Difference of Compression-Rate Increase and Change of Mean Slopes between Initial to 8 Weeks and 8 Weeks to 6 Months
p-value=0.00. *Mean±tandard devation. †Corresponding value±standard error.
Table 3
Single Variable Analysis to Evaluate the Differences of Related Factors between Two Groups*
Values are presented as mean±standard deviation or number (%). *Compression-rate increase: below 15% group and more than 15% group.
Table 4
Logistic Regression Analysis to Evaluate the Influence of Related Factors on the Compression-Rate Increases
*95% confidence interval.

