 E-submission
 TOTA
TOTA TOTS
TOTS
Articles
- Page Path
- HOME > J Musculoskelet Trauma > Volume 20(1); 2007 > Article
-
Original Article
- Factors Confluencing the Result of Percutaneous Balloon Kyphoplasty in Osteoporotic Thoracolumbar Compression Fracture
- Jung-Hee Lee, M.D., Dae-Woo Hwang, M.D., Jae-Heung Shin, M.D., Woo-Sung Hong, M.D., Ju-Wan Kim, M.D.
-
Journal of the Korean Fracture Society 2007;20(1):76-82.
DOI: https://doi.org/10.12671/jkfs.2007.20.1.76
Published online: June 14, 2016
Department of Orthopaedic Surgery, Kyunghee University College of Medicine, Seoul, Korea.
*Department of Orthopedic Surgery, National Medical Center, Seoul, Korea.
- Address reprint requests to: Dae-Woo Hwang, M.D. Department of Orthopedic Surgery, National Medical Center, 18-79, Euljiro 6-ga, Jung-gu, Seoul 100-799, Korea. Tel: 82-2-2260-7193, Fax: 82-2-2278-9570, kmcoshdw@dreamwiz.com
Copyright © The Korean Fracture Society. All rights reserved
- 1,106 Views
- 0 Download
- 1 Crossref
Abstract
-
Purpose
- We are to find the method to objectify postoperative prognosis, analyzing the factors confluencing the result of kyphoplasty in osteoporotic vertebral compression fracture (OVCF).
-
Materials and Methods
- Our study included 50 patients (55 vertebral bodies) who have undergone kyphoplasty from Sep. 2004 until Oct. 2005. We divided in the group according to bone mineral density (BMD), compression rate, recovery rate and cement leakage. We verified the significance of each group, using independent t-test, and ANOVA test among observers.
-
Results
- We performed kyphoplasty on 55 vertebral bodies, 12 cases with more than 0.4 g/cm2 in BMD (mean: 0.53 g/cm2) and their mean preoperative compression rate (CR), immediate postoperative recovery rate (RR-IPO), and recovery rate after 6 months (RR-6M) was each 30.58%, 12.35%P, 9.93%P. 15 cases under 0.4 g/cm2 (mean 0.31 g/cm2), and their CR, RR-IPO and RR-6M was 26.73%, 11.77%P, 5.26%P respectively. The p-value was 0.004. Another studies according to CR, RR-IPO and leakage of cement revealed the better results in the cases of the lower CR, the smaller reduction and abscecnce of cement leakage, but statistically insignificant (p=0.309, 0.069, 0.356).
-
Conclusion
- Preoperative BMD was most important factor that confluencing postoperative radiological result in OVCF. Other factors were also thought to be confluencing factors, but statistically insignificant..
- 1. Amar AP, Larsen DW, Esnaashari N, Albuquerque FC, Lavine SD, Teitelbaum GP. Percutaneous transpedicular polymethylmethacrylate vertebroplasty for the treatment of spinal compression fractures. Neurosurgery, 2001;49:1105-1114.Article
- 2. Barr JD, Barr MS, Lemley TJ, McCann RM. Percutaneous vertebroplasty for pain relief and spinal stabilization. Spine, 2000;25:923-928.Article
- 3. Belkoff SM, Mathis JM, Fenton DC, Scribner RM, Reiley ME, Talmadge K. An ex vivo biomechanical evaluation of an inflatable bone tamp used in the treatment of compression fracture. Spine, 2001;26:151-156.Article
- 4. Bouza C, Lopez T, Magro A, Navalpotro L, Amate JM. Efficacy and safety of balloon kyphoplasty in the treatment of vertebral compression fractures: a systematic review. Eur Spine J, 2006;15:1050-1067.ArticlePDF
- 5. Chan JH, Peh WC, Tsui EY, et al. Acute vertebral body compression fractures: discrimination between benign and malignant causes using apparent diffusion coefficients. Br J Radiol, 2002;75:207-214.Article
- 6. Cotten A, Boutry N, Cortet B, et al. Percutaneous vertebroplasty: state of the art. Radiographics, 1998;18:311-320.Article
- 7. Cummings SR, Kelsey JL, Nevitt MC, O'Dowd KJ. Epidemiology of osteoporosis and osteoporotic fractures. Epidemiol Rev, 1985;7:178-208.Article
- 8. Deramond H, Depriester C, Galibert P, Le Gars D. Percutaneous vertebroplasty with polymethylmethacrylate. Technique, indications, and results. Radiol Clin North Am, 1998;36:533-546.
- 9. Daramond H, Depriester C, Toussaint P, Galibert P. Percutaneous vertebroplasty. Semin Musculoskelet Radiol, 1997;1:285-296.Article
- 10. Hiwatashi A, Sidhu R, Lee RK, deGuzman RR, Piekut DT, Westesson PL. Kyphoplasty versus vertebroplasty to increase vertebral body height: a cadaveric study. Radiology, 2005;237:1115-1119.Article
- 11. Horikawa K, Kasai Y, Yamakawa T, Sudo A, Uchida A. Prevalence of osteoarthritis, osteoporotic vertebral fractures, and spondylolisthesis among the elderly in a Japanese village. J Orthop Surg(Hong Kong), 2006;14:9-12.ArticlePDF
- 12. Jahng JS, Kang KS, Park HW, Han MH. The assessment of bone mineral density in postmenopausal and senile osteoporosis using quantitative computed tomography. J Korean Orthop Assoc, 1990;25:262-269.ArticlePDF
- 13. Jensen ME, Kallmes DE. Percutaneous vertebroplasty in the treatment of malignant spine disease. Cancer J, 2002;8:194-206.Article
- 14. Joh JY, Bae YG, Kim YH, et al. Retrograde study on thoracic percutaneous vertebroplasty and kyphoplasty done by transpedicular approach. Korean J Pain, 2005;18:204-207.Article
- 15. Jungreis CA, Cohen WA. Spinal cord compression induced by steroid therapy: CT findings. J Comput Assist Tomogr, 1987;11:245-247.
- 16. Kado DM, Browner WS, Palermo L, Nevitt MC, Genant HK, Cummings SR. Vertebral fractures and mortality in older women: a prospective study. Study of Osteoporotic Fractures Research Group. Arch Intern Med, 1999;159:1215-1220.Article
- 17. Khanna AJ, Reinhardt MK, Togawa D, Lieberman IH. Functional outcomes of kyphoplasty for the treatment of osteoporotic and osteolytic vertebral compression fractures. Osteoporos Int, 2006;17:817-826.ArticlePDF
- 18. Martin JB, Jean B, Sugiu K, et al. Vertebroplasty: clinical experience and follow-up results. Bone, 1999;25:Suppl 2. 11S-15S.Article
- 19. Moreland DB, Landi MK, Grand W. Vertebroplasty: techniques to avoid complications. Spine J, 2001;1:66-71.
- 20. Rhyne A 3rd, Banit D, Laxer E, Odum S, Nussman D. Kyphoplasty: report of eighty-two thoracolumbar osteoporotic vertebral fractures. J Orthop Trauma, 2004;18:294-299.Article
- 21. Suk SI, Lee CK, Kang HS, et al. Vertebral fracture in osteoporosis. J Korean Orthop Assoc, 1993;28:980-987.ArticlePDF
- 22. Theodorou DJ, Theodorou SJ, Duncan TD, Garfin SR, Wong WH. Percutaneous balloon kyphoplasty for the correction of spinal deformity in painful vertebral body compression fractures. Clin Imaging, 2002;26:1-5.Article
- 23. Voggenreiter G. Balloon kyphoplasty is effective in deformity correction of osteoporotic vertebral compression fractures. Spine, 2005;30:2806-2812.Article
REFERENCES
Fig. 1
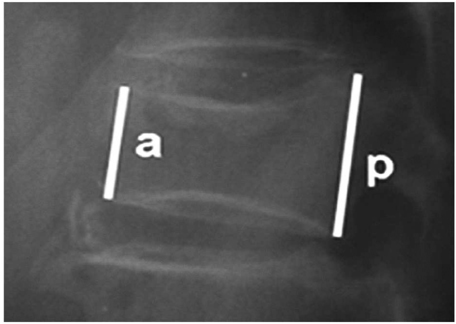
Image of the L2 vertebral body from 80-years-old woman. a: Anterior height of vertebral body, p: Posterior height of vertebral body. Compression rate (%): (p-a)*100/p, Immediate recovery rate (%point): Preoperative compression rate-Immediate post-operative compression rate, Follow up recovery rate (%point): Preoperative compression rate-Follow up compression rate.
Fig. 2
(A) Preoperative lateral radiograph showed L1 compression fracture (compression rate: 20%).
(B) Postoperative lateral radiograph showed kyphoplasty on T12 (recovery rate: 10%).
(C) Postoperative 6 months follow up lateral radiograph (recovery rate: 6%).
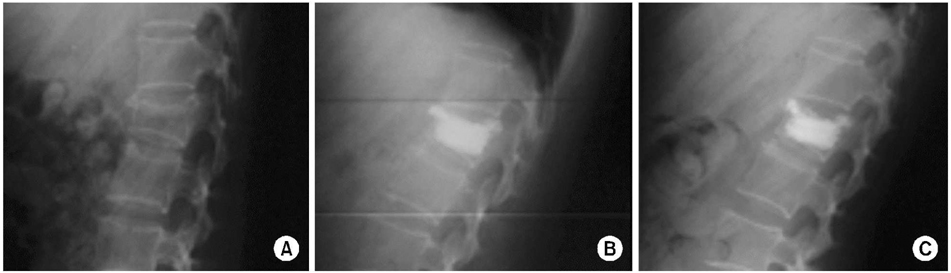
Simple radiographs of 74 years old male has BMD score 0.333 with L1 compression fracture.
Fig. 3
(A) Preoperative lateral radiograph showed T12 compression fracture (compression rate: 15%).
(B) Postoperative lateral radiograph showed kyphoplasty on T12 (recovery rate: 12%).
(C) Postoperative 6months follow up lateral radiograph (recovery rate: 12%).
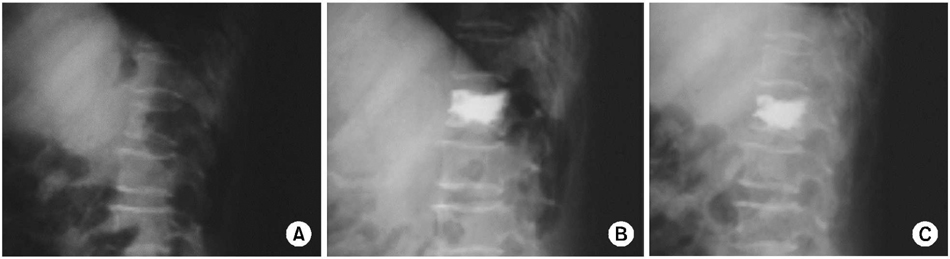
Simple radiographs of 74 years old female has compression fracture on T12.
Fig. 4
(A) Preoperative lateral radiograph showed T12 compression fracture (compression rate: 35%).
(B) Postoperative lateral radiograph showed kyphoplasty on T12 (recovery rate: 17%).
(C) Postoperative 6months follow up lateral radiograph (recovery rate: 3%)
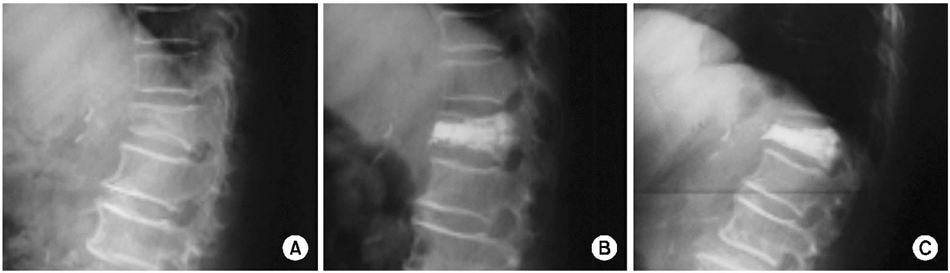
Simple radiographs of 80 years old female has compression fracture on T12.
Fig. 5
(A) Preoperative lateral radiograph showed T8 compression fracture (compression rate: 24%).
(B) Postoperative lateral radiograph showed kyphoplasty on T8 (recovery rate: 3%).
(C) Postoperative 6 months follow up lateral radiograph (recovery rate: 3%).
(D) CT scan of T8 with endplate crack.

Simple radiographs of 74 years old male with T8 compression fracture.
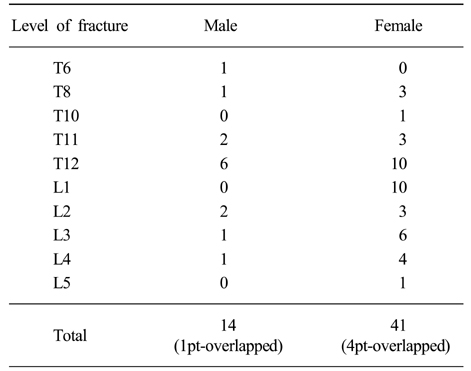
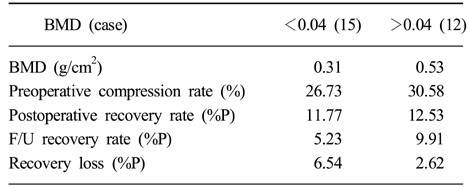
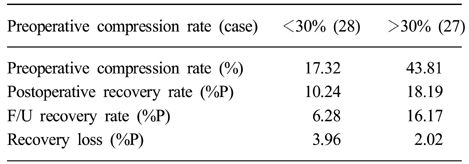
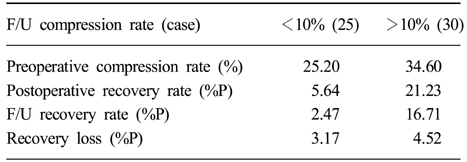
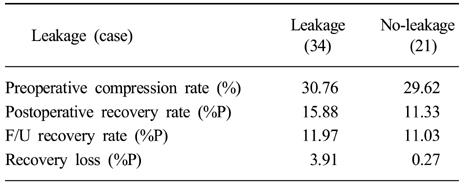
Figure & Data
REFERENCES
Citations
Citations to this article as recorded by 
- Cement Leakage into Disc after Kyphoplasty: Does It Increases the Risk of New Adjacent Vertebral Fractures?
Hoon-Sang Sohn, Seong-Kee Shin, Eun-Seok Seo, Kang-Seob Chang
Journal of the Korean Fracture Society.2011; 24(4): 361. CrossRef
 Cite
CiteFactors Confluencing the Result of Percutaneous Balloon Kyphoplasty in Osteoporotic Thoracolumbar Compression Fracture


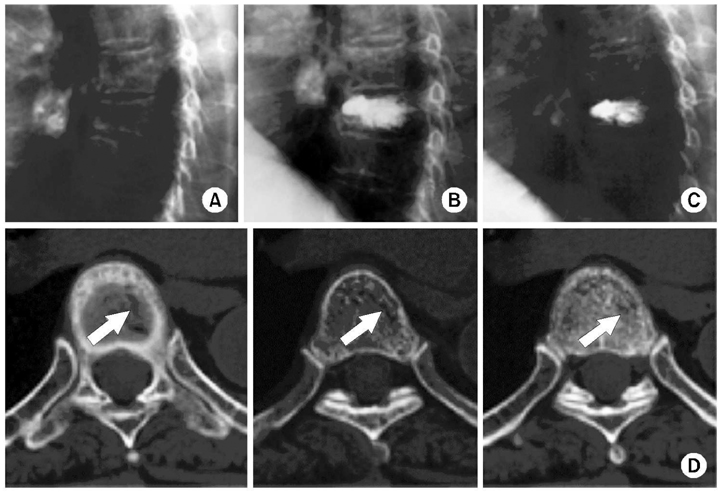
Fig. 1
Image of the L2 vertebral body from 80-years-old woman. a: Anterior height of vertebral body, p: Posterior height of vertebral body. Compression rate (%): (p-a)*100/p, Immediate recovery rate (%point): Preoperative compression rate-Immediate post-operative compression rate, Follow up recovery rate (%point): Preoperative compression rate-Follow up compression rate.
Fig. 2
Simple radiographs of 74 years old male has BMD score 0.333 with L1 compression fracture.
(A) Preoperative lateral radiograph showed L1 compression fracture (compression rate: 20%).
(B) Postoperative lateral radiograph showed kyphoplasty on T12 (recovery rate: 10%).
(C) Postoperative 6 months follow up lateral radiograph (recovery rate: 6%).
Fig. 3
Simple radiographs of 74 years old female has compression fracture on T12.
(A) Preoperative lateral radiograph showed T12 compression fracture (compression rate: 15%).
(B) Postoperative lateral radiograph showed kyphoplasty on T12 (recovery rate: 12%).
(C) Postoperative 6months follow up lateral radiograph (recovery rate: 12%).
Fig. 4
Simple radiographs of 80 years old female has compression fracture on T12.
(A) Preoperative lateral radiograph showed T12 compression fracture (compression rate: 35%).
(B) Postoperative lateral radiograph showed kyphoplasty on T12 (recovery rate: 17%).
(C) Postoperative 6months follow up lateral radiograph (recovery rate: 3%)
Fig. 5
Simple radiographs of 74 years old male with T8 compression fracture.
(A) Preoperative lateral radiograph showed T8 compression fracture (compression rate: 24%).
(B) Postoperative lateral radiograph showed kyphoplasty on T8 (recovery rate: 3%).
(C) Postoperative 6 months follow up lateral radiograph (recovery rate: 3%).
(D) CT scan of T8 with endplate crack.
Fig. 1
Fig. 2
Fig. 3
Fig. 4
Fig. 5
Factors Confluencing the Result of Percutaneous Balloon Kyphoplasty in Osteoporotic Thoracolumbar Compression Fracture
Patients' demographics
Comparision according to BMD
p-value: 0.004.
Comparision according to preoperative compression rate
p-value: 0.309.
Comparision according to postoperatve recovery rate
p-value: 0.069.
Comparision according to the existence of cement leakage or not
p-value: 0.356.
Table 1
Patients' demographics
Table 2
Comparision according to BMD
p-value: 0.004.
Table 3
Comparision according to preoperative compression rate
p-value: 0.309.
Table 4
Comparision according to postoperatve recovery rate
p-value: 0.069.
Table 5
Comparision according to the existence of cement leakage or not
p-value: 0.356.

