 E-submission
 TOTA
TOTA TOTS
TOTS
Articles
- Page Path
- HOME > J Musculoskelet Trauma > Volume 21(4); 2008 > Article
-
Original Article
- The Relationship between Progression of Body Collapse and MRI Findings in Osteoporotic Stable Thoracolumbar Fractures
- Young Do Koh, M.D., Jong Seok Yoon, M.D., Ji Young Hwang, M.D., Hyun Sik Park, M.D.
-
Journal of the Korean Fracture Society 2008;21(4):304-311.
DOI: https://doi.org/10.12671/jkfs.2008.21.4.304
Published online: October 31, 2008
Department of Orthopedic Surgery, Ewha Womans University School of Medicine, Seoul, Korea.
*Department of Radiology, Ewha Womans University School of Medicine, Seoul, Korea.
- Address reprint requests to: Young-Do Koh, M.D. Department of Orthopedic Surgery, Ewha Womans University Hospital, 911-1, Mok 6-dong, Yangcheon-gu, Seoul 158-710, Korea. Tel: 82-2-2650-5564, Fax: 82-2-2642-0349, ydkoh@ewha.ac.kr
• Received: July 15, 2008 • Revised: October 5, 2008 • Accepted: October 13, 2008
Copyright © 2008 The Korean Fracture Society. All rights reserved.
This is an Open Access article distributed under the terms of the Creative Commons Attribution Non-Commercial License (http://creativecommons.org/licenses/by-nc/3.0/) which permits unrestricted non-commercial use, distribution, and reproduction in any medium, provided the original work is properly cited.
- 1,278 Views
- 1 Download
- 4 Crossref
Abstract
-
Purpose
- To find out the relationship between the initial Magnetic Resonance Image (MRI) findings and the progression of vertebra collapse when treated with Jewett brace in osteoporotic stable thoracolumbar fractures.
-
Materials and Methods
- We divided 38 cases of 37 patients of thoracolumbar osteoporotic stable thoracolumbar fractures who were treated with Jewett brace into two groups. One group was composed of those body collapse progressed more than 10% compared with the initial state, and the other group less than 10%. We analyzed the relationships between the progression of collapse and the superior endplate fractures, the fracture line extending to posterior cortex, the size of bone marrow edema, the signal intensity on T1 and T2 weighted MR images, the presence of paravertebral hematoma, and the degree of posterior extensor muscle atrophy using MR images.
-
Results
- The body collapse was more likely to progress when there was superior endplate fracture, when it showed larger size of bone marrow edema on T1 weighted image, and transverse low signal on T2 weighted image. But extending of fracture line to posterior cortex, presence of paravertebral hematoma, and degree of posterior extensor muscle atrophy did not show any statistical correlations to progression of collapse.
-
Conclusion
- The body collapse is more likely to progress when there was superior endplate fracture, larger low signal on T1 weighted image and low signal on T2 weighted image at initial MRI treated with Jewett brace.
- 1. Ağuş H, Kayali C, Arslantaş M. Nonoperative treatment of burst-type thoracolumbar vertebra fractures: clinical and radiological results of 29 patients. Eur Spine J, 2005;14:536-540.ArticlePDF
- 2. Akbarnia BA, Crandall DG, Burkus K, Matthews T. Use of long rods and a short arthrodesis for burst fractures of the thoracolumbar spine. A long-term follow-up study. J Bone Joint Surg Am, 1994;76:1629-1635.Article
- 3. Alanay A, Yazici M, Acaroglu E, Turhan E, Cila A, Surat A. Course of nonsurgical management of burst fractures with intact posterior ligamentous complex: an MRI study. Spine, 2004;29:2425-2431.Article
- 4. Baba H, Maezawa Y, Kamitani K, Furusawa N, Imura S, Tomita K. Osteoporotic vertebral collapse with late neurological complications. Paraplegia, 1995;33:281-289.ArticlePDF
- 5. Cantor JB, Lebwohl NH, Garvey T, Eismont FJ. Nonoperative management of stable thoracolumbar burst fractures with early ambulation and bracing. Spine, 1993;18:971-976.Article
- 6. Chow GH, Nelson BJ, Gebhard JS, Brugman JL, Brown CW, Donaldson DH. Functional outcome of thoracolumbar burst fractures managed with hyperextension casting or bracing and early mobilization. Spine, 1996;21:2170-2175.Article
- 7. Goutallier D, Postel JM, Bernageau J, Lavau L, Voisin MC. Fatty muscle degeneration in cuff ruptures. Pre- and postoperative evaluation by CT scan. Clin Orthop Relat Res, 1994;304:78-83.
- 8. Jacobs RR, Asher MA, Snider RK. Thoracolumbar spinal injuries. A comparative study of recumbent and operative treatment in 100 patients. Spine, 1980;5:463-477.Article
- 9. James KS, Wenger KH, Schlegel JD, Dunn HK. Biomechanical evaluation of the stability of thoracolumbar burst fractures. Spine, 1994;19:1731-1740.Article
- 10. Kaneda K, Ito M, Taneichi H, Sato S, Abumi K, Asano S. Osteoporotic posttraumatic vertebral collapse with neurological deficits of the thoracolumar spine: anterior decompression and reconstruction. Rinsho Seikei Geka, 1996;31:463-470.
- 11. Kaplan PA, Orton DF, Aselson RJ. Osteoporosis with vertebral compression fractures, retropulsed fragments, and neurologic compromise. Radiology, 1987;165:533-535.Article
- 12. Magerl F, Aebi M, Gertzbein SD, Harms J, Nazarian S. A comprehensive classification of thoracic and lumbar injuries. Eur Spine J, 1994;3:184-201.ArticlePDF
- 13. McAfee PC, Yuan HA, Fredrickson BE, Lubicky JP. The value of computed tomography in thoracolumbar fractures. An analysis of one hundred consecutive cases and a new classification. J Bone Joint Surg Am, 1983;65:461-473.Article
- 14. Mumford J, Weinstein JN, Spratt KF, Goel VK. Thoracolumbar burst fractures. The clinical efficacy and outcome of nonoperative management. Spine, 1993;18:955-970.Article
- 15. Oner FC, van Gils AP, Dhert WJ, Verbout AJ. MRI findings of thoracolumbar spine fractures: a categorization based on MRI examinations of 100 fractures. Skeletal Radiol, 1999;28:433-443.
- 16. Oner FC, van Gils AP, Faber JA, Dhert WJ, Verbout AJ. Some complications of common treatment schemes of thoracolumbar spine fractures can be predicted with magnetic resonance imaging: prospective study of 53 patients with 71 fractures. Spine, 2002;27:629-636.Article
- 17. Tezer M, Erturer RE, Ozturk C, Ozurk I, Kuzgun U. Conservative treatment of fractures of thoracolumbar spine. Int Orthop, 2005;29:78-82.
- 18. Tropiano P, Huang RC, Louis CA, Poitout DG, Louis RP. Functional and radiographic outcome of thoracolumbar and lumbar burst fractures managed by closed orthopaedic reduction and casting. Spine, 2003;28:2459-2465.Article
- 19. Weinstein JN, Collalto P, Lehmann TR. Thoracolumbar "burst" fractures treated conservatively: a long-term follow-up. Spine, 1988;13:33-38.Article
- 20. Young MH. Long-term consequences of stable fractures of the thoracic and lumbar vertebral bodies. J Bone Joint Surg Br, 1973;55:295-300.ArticlePDF
REFERENCES
Fig. 1
(A) Grade 1 is less than 25%.
(B) Grade 2 is between 25~50%.
(C) Grade 3 is between 50~75%.
(D) Grade 4 is beyond 75%.
Size of bone marrow edema on T1-weighted image.
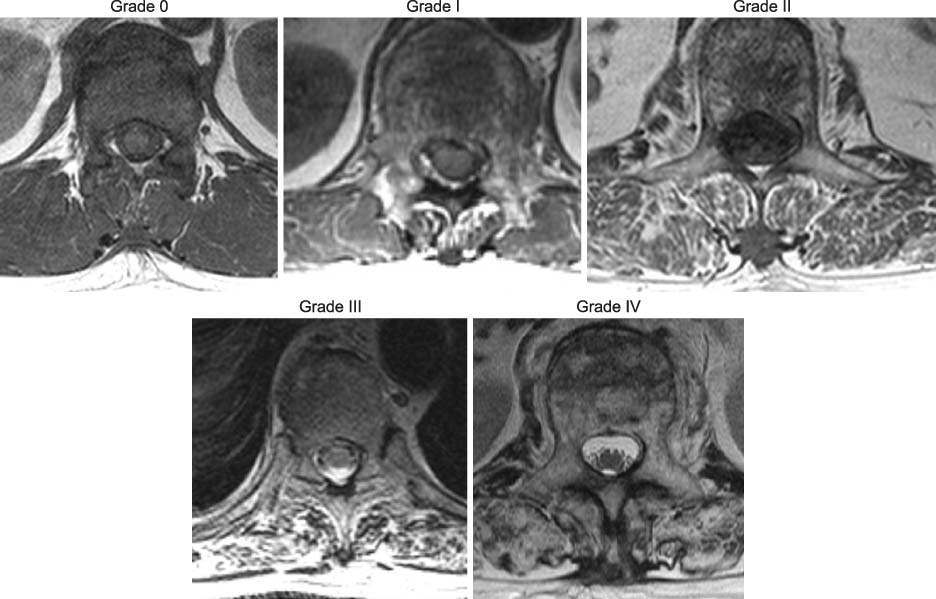
Fig. 3
Thoracolumbar vertebra height were reported as fractions of referent height. Thoracolumbar vertebra height (%)=2Hf / (Hs+Hi) *100. Compression ratio = 1-thoracolumbar vertebra height (%).

Fig. 5
(B, C) CT sagittal image and sagittal T2-weighted image, an superior endplate fracture line is found, but the fracture line which extends to the posterior cortex is not found.
(D) On the plain radiograph after 6 months, there is a progression of height loss of the fractured body compared with initial film.

(A) Initial plain radiogragh.
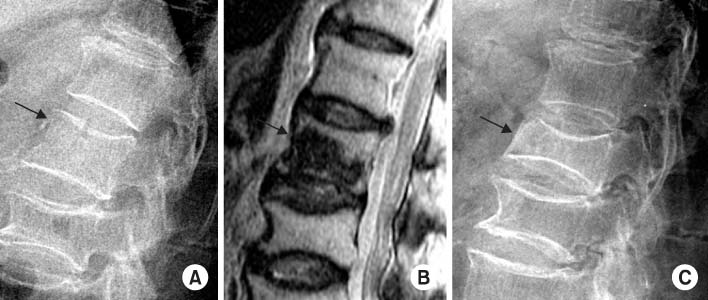
Fig. 6
L1 vertebral body fracture with fracture line involved to the posterior cortex. At 10 month follow up, the compression progress is 8% noted.
Fig. 7
(B) Intermediate to low signal intensity line on T2 weighted image.
(C) On the plain radiograph taken after 6 months, there is an additional 30% height loss compared with the initial film.
(A) Initial plain radiograph of L1 fracture.
Fig. 8
(B) On T2 weighted MR image, intermediate to low signal intensity line (white arrow) is corresponds to the low density of MDCT image.

(A) On sagittal multiplanar reconstruction image of Modified discrete cosine transform multidetector computed tomography (MDCT), there is transverse low density at a thoracolumbar vertebra, which is supposed to be a defect of cancellous bone (white arrow).
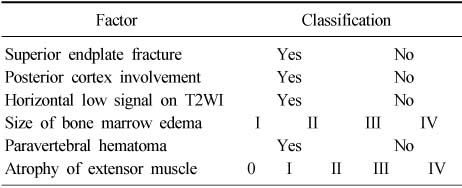
Figure & Data
REFERENCES
Citations
Citations to this article as recorded by 
- The Factors between the Progression of the Compression Rate and Magnetic Resonance Imaging Findings in Osteoporotic Vertebral Fracture Patients Treated with Teriparatide
Taebyeong Kang, Seung-Pyo Suh, Jeongwoon Han, Byungjun Kang, Changhyun Park
Journal of the Korean Orthopaedic Association.2023; 58(5): 392. CrossRef - Statistical Analysis on Hospitalized Patients with Thoracolumbar Compression Fracture at Single Korean Medicine Hospital: Retrospective Review
Hyun jin Jang, So jeong Kim, Min Ju Kim, Hyeon Kyu Choi, Pil Je Park, Kang Yeon soo, Jeong Kyo Jeong, Ju Hyun Jeon, Young Il Kim
Journal of Korean Medicine.2023; 44(2): 149. CrossRef - The Influence of Initial Magnetic Resonance Imaging Findings on the Compression Rate of Thoracolumbar Osteoporotic Vertebral Compression Fracture
Seok-Ha Hwang, Seung-Pyo Suh, Young-Kyun Woo, Ho-Seung Jeon, Ho-Won Jeong
Journal of the Korean Orthopaedic Association.2018; 53(4): 341. CrossRef - The Relationship between the Progression of Kyphosis in Stable Thoracolumbar Fractures and Magnetic Resonance Imaging Findings
Deuk Soo Jun, Won Ju Shin, Byoung Keun An, Je Won Paik, Min Ho Park
Asian Spine Journal.2015; 9(2): 170. CrossRef
 Cite
CiteThe Relationship between Progression of Body Collapse and MRI Findings in Osteoporotic Stable Thoracolumbar Fractures


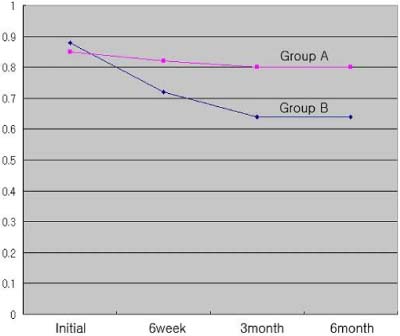
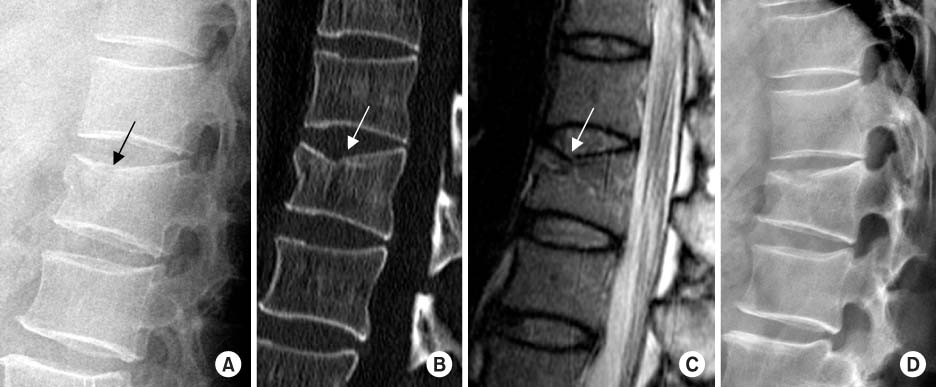


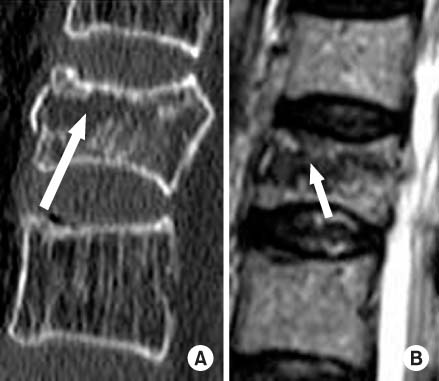
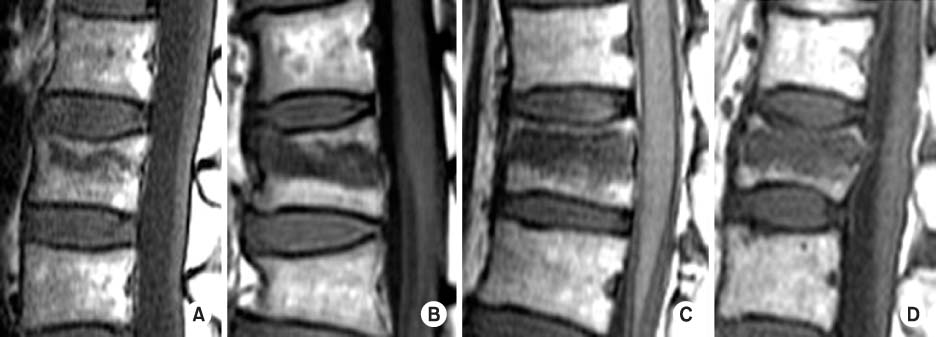
Fig. 1
Size of bone marrow edema on T1-weighted image.
(A) Grade 1 is less than 25%.
(B) Grade 2 is between 25~50%.
(C) Grade 3 is between 50~75%.
(D) Grade 4 is beyond 75%.
Fig. 2
Classification of paravertebral muscle atropy accoding to Goutallier classification.
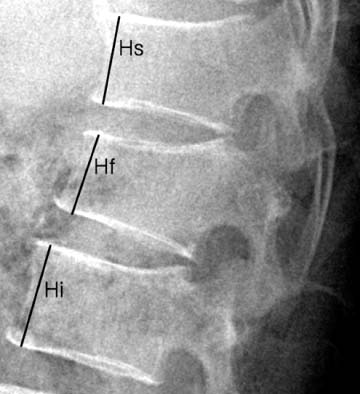
Fig. 3
Thoracolumbar vertebra height were reported as fractions of referent height. Thoracolumbar vertebra height (%)=2Hf / (Hs+Hi) *100. Compression ratio = 1-thoracolumbar vertebra height (%).
Fig. 4
Progression of compression of whole patient in relation to follow up period.
Fig. 5
(A) Initial plain radiogragh.
(B, C) CT sagittal image and sagittal T2-weighted image, an superior endplate fracture line is found, but the fracture line which extends to the posterior cortex is not found.
(D) On the plain radiograph after 6 months, there is a progression of height loss of the fractured body compared with initial film.
Fig. 6
L1 vertebral body fracture with fracture line involved to the posterior cortex. At 10 month follow up, the compression progress is 8% noted.
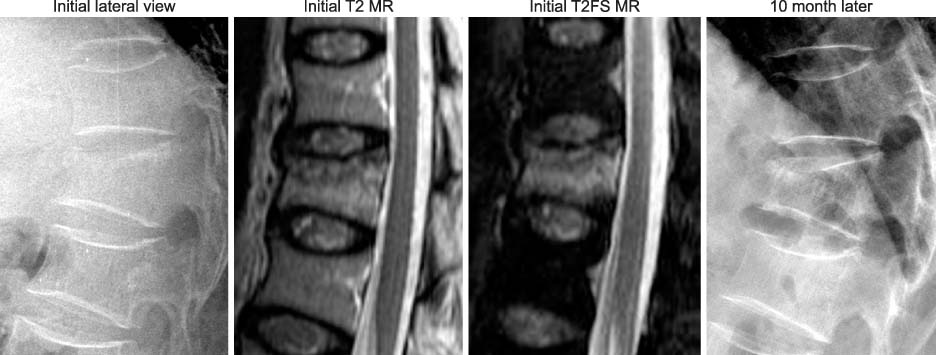
Fig. 7
(A) Initial plain radiograph of L1 fracture.
(B) Intermediate to low signal intensity line on T2 weighted image.
(C) On the plain radiograph taken after 6 months, there is an additional 30% height loss compared with the initial film.
Fig. 8
(A) On sagittal multiplanar reconstruction image of Modified discrete cosine transform multidetector computed tomography (MDCT), there is transverse low density at a thoracolumbar vertebra, which is supposed to be a defect of cancellous bone (white arrow).
(B) On T2 weighted MR image, intermediate to low signal intensity line (white arrow) is corresponds to the low density of MDCT image.
Fig. 1
Fig. 2
Fig. 3
Fig. 4
Fig. 5
Fig. 6
Fig. 7
Fig. 8
The Relationship between Progression of Body Collapse and MRI Findings in Osteoporotic Stable Thoracolumbar Fractures
The MRI factors that we consider which influence progression of compression of vertebral body
Table 1
The MRI factors that we consider which influence progression of compression of vertebral body

