 E-submission
 TOTA
TOTA TOTS
TOTS
Articles
- Page Path
- HOME > J Musculoskelet Trauma > Volume 22(1); 2009 > Article
-
Original Article
- The Usefulness of Hip to Thigh Ratio as an Anthropometric Indicator for the Incidence of Hip Fracture
- Jin Park, M.D., Kyu Hyun Yang, M.D., Seong Hwan Moon, M.D.
-
Journal of the Korean Fracture Society 2009;22(1):1-5.
DOI: https://doi.org/10.12671/jkfs.2009.22.1.1
Published online: January 31, 2009
Department of Orthopaedic Surgery, Ajou University School of Medicine, Suwon, Korea.
*Department of Orthopaedic Surgery, Yonsei University College of Medicine, Seoul, Korea.
- Address reprint requests to: Seong Hwan Moon, M.D. Department of Orthopaedic Surgery, Yonsei University College of Medicine, 250, Seongsan-ro, Seodaemun-gu, Seoul 120-752, Korea. Tel: 82-2-2228-218, Fax: 82-2-361-1139, shmoon@yuhs.ac
• Received: September 1, 2008 • Revised: October 20, 2008 • Accepted: November 7, 2008
Copyright © 2009 The Korean Fracture Society. All rights reserved.
This is an Open Access article distributed under the terms of the Creative Commons Attribution Non-Commercial License (http://creativecommons.org/licenses/by-nc/3.0/) which permits unrestricted non-commercial use, distribution, and reproduction in any medium, provided the original work is properly cited.
- 1,030 Views
- 2 Download
Abstract
-
Purpose
- To compare anthropometric indicators around the hip between osteoporotic fracture group and control group.
-
Materials and Methods
- Thirty patients for osteoporotic hip fracture and the same number of patients for spine fracture who admitted our institute from November 2006 to March 2007 were matched with control patients without osteoporotic fracture. The waist circumference (WC), hip circumference (HC), thigh circumference (TC), and height were measured. From these measurements, waist to hip ratio (WHR), waist to thigh ratio (WTR), hip to thigh ratio (HTR), waist to height ratio (WHtR), hip to height ratio (HHtR), and thigh to height ratio (THtR) were calculated. All these indicators were compared between hip fracture and control group, and between spine fracture and control group.
-
Results
- Comparison between spine fracture and control group showed that the WC, WHR, WHtR were statistically significant, but all indicators failed to show accuracy in the ROC analysis. Comparison between hip fracture and control group demonstrated the TC, WTR, HTR, WHtR, HHtR, THtR were statistically significant. However, only the HTR showed fair accuracy in the ROC analysis. The area under the curve (AUC) of the HTR was 0.75 (95% confidence interval, 0.62 to 0.87) (p=0.001).
-
Conclusion
- The HTR was fairly accurate in predicting the incidence of hip fracture compared with any other anthropometric indicators. Therefore, we can consider that the HTR has clinical usefulness.
- 1. Chuang YC, Hsu KH, Hwang CJ, Hu PM, Lin TM, Chiou WK. Waist-to-thigh ratio can also be a better indicator associated with type 2 diabetes than traditional anthropometrical measurements in Taiwan population. Ann Epidemiol, 2006;16:321-331.Article
- 2. Cooper C. The crippling consequences of fractures and their impact on quality of life. Am J Med, 1997;103:12S-17S. discussion 7S-9S.Article
- 3. Craig P, Samaras K, Freund J, Culton N, Halavatau V, Campbell L. BMI inaccurately reflects total body and abdominal fat in Tongans. Acta Diabetol, 2003;40:Suppl 1. S282-S285.ArticlePDF
- 4. Cummings SR, Nevitt MC. A hypothesis: the causes of hip fractures. J Gerontol, 1989;44:M107-M111.Article
- 5. Cummings SR, Rubin SM, Black D. The future of hip fractures in the United States. Numbers, costs, and potential effects of postmenopausal estrogen. Clin Orthop Relat Res, 1990;252:163-166.
- 6. Esmaillzadeh A, Mirmiran P, Azizi F. Waist-to-hip ratio is a better screening measure for cardiovascular risk factors than other anthropometric indicators in Tehranian adult men. Int J Obes Relat Metab Disord, 2004;28:1325-1332.ArticlePDF
- 7. Faulkner KG. The tale of the T-score: review and perspective. Osteoporos Int, 2005;16:347-352.ArticlePDF
- 8. Forsén L, Søgaard AJ, Sandvig S, Schuller A, Røed U, Arstad C. Risk of hip fracture in protected and unprotected falls in nursing homes in Norway. Inj Prev, 2004;10:16-20.Article
- 9. Gallagher B, Corbett E, Freeman L, et al. A fall prevention program for the home environment. Home Care Provid, 2001;6:157-163.Article
- 10. Hayes WC, Myers ER, Morris JN, Gerhart TN, Yett HS, Lipsitz LA. Impact near the hip dominates fracture risk in elderly nursing home residents who fall. Calcif Tissue Int, 1993;52:192-198.ArticlePDF
- 11. Kannus P, Parkkari J, Niemi S, et al. Prevention of hip fracture in elderly people with use of a hip protector. N Engl J Med, 2000;343:1506-1513.Article
- 12. Kim JO, Yoen YH, Ko YD, et al. The prefracture factors on the hip fracture in elderly. J Korean Soc Fract, 2002;15:531-537.Article
- 13. Koval KJ, Aharonoff GB, Rokito AS, Lyon T, Zuckerman JD. Patients with femoral neck and intertrochanteric fractures. Are they the same? Clin Orthop Relat Res, 1996;166-172.
- 14. Lauritzen JB, Petersen MM, Lund B. Effect of external hip protectors on hip fractures. Lancet, 1993;341:11-13.Article
- 15. Mautalen CA, Vega EM, Einhorn TA. Are the etiologies of cervical and trochanteric hip fractures different? Bone, 1996;18:3 Suppl. 133S-137S.Article
- 16. Moon SH, Suh BH, Kim DJ, Kong GM, Cho HG. Comparison of bone mineral density in elderly patients according to presence of intertrochanteric fracture. J Korean Fract Soc, 2007;20:222-226.Article
- 17. Rico H, Relea P, Crespo R, et al. Biochemical markers of nutrition in type-I and type-II osteoporosis. J Bone Joint Surg Br, 1995;77:148-151.ArticlePDF
- 18. Rubenstein L. Hip protectors-a breakthrough in fracture prevention. N Engl J Med, 2000;343:1562-1563.Article
- 19. Schneider HJ, Glaesmer H, Klotsche J, et al. Accuracy of anthropometric indicators of obesity to predict cardiovascular risk. J Clin Endocrinol Metab, 2007;92:589-594.Article
REFERENCES
Fig. 1Receiver operation characteristic (ROC) curve of hip to thigh circumference ratio (HTR) between hip fracture and control group shows that the area under the curve (AUC) representing the accuracy of HTR is 0.75 (95% confidence interval, 0.62 to 0.87) (p<0.05).

Table 1Data of anthropometric indicators of hip fracture group, spine fracture group, and control groups
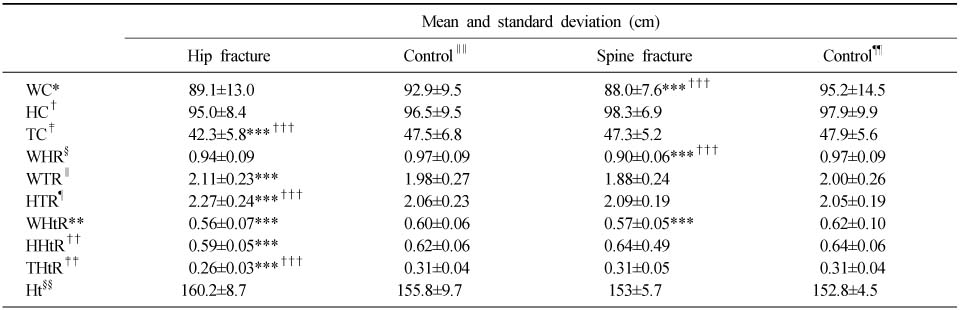
*WC: Waist circumference, †HC: Hip circumference, ‡TC: Thigh circumference, §WHR: Waist to hip ratio, ∥ WTR: Waist to thigh ratio, ¶HTR: Hip to thigh ratio, **WHtR: Waist to height ratio, ††HHtR: Hip to height ratio, ‡‡THtR: Thigh to height ratio, §§Ht: Height, ∥∥ Control: Control group matched with hip fracture group, ¶¶Control: Control group matched with spine fracture group. ***statistically significant with independent T test using the original alpha level (p=0.05), †††statistically significant with independent T test using the adjusted alpha level by the Bonferroni correction.
Table 2The area under the curve (AUC) of the estimated by receiver operation characteristic (ROC) analyses of anthropometric indicators
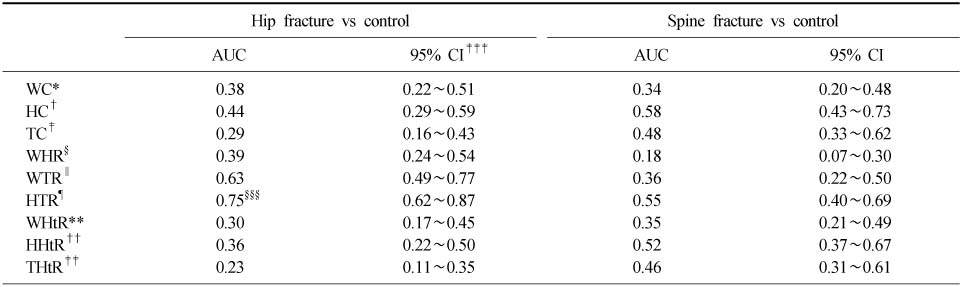
Abbreviations as in Table 1. ‡‡‡CI: Confidence interval, §§§shows the highest accuracy than any other anthropometric indicators.
Figure & Data
REFERENCES
Citations
Citations to this article as recorded by 
 Cite
CiteThe Usefulness of Hip to Thigh Ratio as an Anthropometric Indicator for the Incidence of Hip Fracture
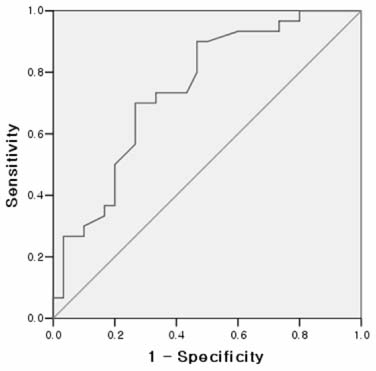
Fig. 1
Receiver operation characteristic (ROC) curve of hip to thigh circumference ratio (HTR) between hip fracture and control group shows that the area under the curve (AUC) representing the accuracy of HTR is 0.75 (95% confidence interval, 0.62 to 0.87) (p<0.05).
Fig. 1
The Usefulness of Hip to Thigh Ratio as an Anthropometric Indicator for the Incidence of Hip Fracture
Data of anthropometric indicators of hip fracture group, spine fracture group, and control groups
*WC: Waist circumference, †HC: Hip circumference, ‡TC: Thigh circumference, §WHR: Waist to hip ratio, ∥ WTR: Waist to thigh ratio, ¶HTR: Hip to thigh ratio, **WHtR: Waist to height ratio, ††HHtR: Hip to height ratio, ‡‡THtR: Thigh to height ratio, §§Ht: Height, ∥∥ Control: Control group matched with hip fracture group, ¶¶Control: Control group matched with spine fracture group. ***statistically significant with independent T test using the original alpha level (p=0.05), †††statistically significant with independent T test using the adjusted alpha level by the Bonferroni correction.
The area under the curve (AUC) of the estimated by receiver operation characteristic (ROC) analyses of anthropometric indicators
Abbreviations as in
Table 1
Data of anthropometric indicators of hip fracture group, spine fracture group, and control groups
*WC: Waist circumference, †HC: Hip circumference, ‡TC: Thigh circumference, §WHR: Waist to hip ratio, ∥ WTR: Waist to thigh ratio, ¶HTR: Hip to thigh ratio, **WHtR: Waist to height ratio, ††HHtR: Hip to height ratio, ‡‡THtR: Thigh to height ratio, §§Ht: Height, ∥∥ Control: Control group matched with hip fracture group, ¶¶Control: Control group matched with spine fracture group. ***statistically significant with independent T test using the original alpha level (p=0.05), †††statistically significant with independent T test using the adjusted alpha level by the Bonferroni correction.
Table 2
The area under the curve (AUC) of the estimated by receiver operation characteristic (ROC) analyses of anthropometric indicators
Abbreviations as in

