 E-submission
 TOTA
TOTA TOTS
TOTS
Articles
- Page Path
- HOME > J Musculoskelet Trauma > Volume 38(4); 2025 > Article
-
Original Article
- Risk factors for ankle fractures in older adults based on clinical components of the Fracture Risk Assessment (FRAX) tool and comorbidities in Korea: a retrospective case-control study
-
Myeong Jun Song1
 , Se Woong Jang1, Jun Young Lee1, Seojin Park2
 -
Journal of Musculoskeletal Trauma 2025;38(4):193-202.
DOI: https://doi.org/10.12671/jmt.2025.00143
Published online: October 24, 2025
1Department of Orthopedic Surgery, Chosun University College of Medicine, Gwangju, Korea
2Department of Nursing Science, Gwangju University, Gwangju, Korea
- Correspondence to: Jun Young Lee Department of Orthopedic Surgery, Chosun University Hospital, 365 Pilmun-daero, Dong-gu, Gwangju 61453, Korea Tel: +82-62-220-3140 Email: leejy88@chosun.ac.kr
• Received: March 10, 2025 • Revised: July 14, 2025 • Accepted: August 4, 2025
© 2025 The Korean Orthopaedic Trauma Association
This is an Open Access article distributed under the terms of the Creative Commons Attribution Non-Commercial License (http://creativecommons.org/licenses/by-nc/4.0/) which permits unrestricted noncommercial use, distribution, and reproduction in any medium, provided the original work is properly cited.
- 1,529 Views
- 30 Download
Abstract
-
Background Ankle fractures are common in older adults; however, their relationship with osteoporotic fractures remains unclear. This study aimed to evaluate potential risk factors for ankle fractures in older adults by analyzing individual clinical components of the Fracture Risk Assessment (FRAX) tool and comorbidities.
-
Methods We conducted a retrospective case-control study including 84 patients aged ≥65 years with ankle fractures and 150 controls who underwent bone mineral density (BMD) testing without prior ankle fractures. The variables analyzed included age, sex, body mass index, smoking, alcohol consumption, prior fracture history, and comorbidities such as hypertension, diabetes mellitus, and dementia. BMD was measured at the spine, total hip, and femoral neck.
-
Results Univariate analysis showed that alcohol consumption, diabetes mellitus, and total hip T-score categories were significantly associated with ankle fractures. In binary logistic regression, alcohol consumption remained significantly associated with higher ankle fracture risk (odds ratio [OR], 5.302; 95% confidence interval [CI], 1.778–15.811; P=0.003), and both osteopenia and osteoporosis at the total hip were also associated with increased risk (OR, 3.260, P=0.049; OR, 3.561, P=0.031, respectively). Diabetes mellitus did not reach statistical significance in the adjusted model (P=0.074). Model fit was adequate (Hosmer-Lemeshow P=0.377), and post hoc power analysis confirmed sufficient sample size.
-
Conclusions These findings suggest that lower total hip BMD and alcohol-related factors may be associated with ankle fracture risk in older adults. The FRAX score itself was not calculated; instead, this study focused on analyzing selected clinical components. Limitations include the retrospective design, lack of fall and medication data, and cross-sectional BMD assessment.
-
Level of evidence III.
Introduction
Ankle fractures are increasing in incidence due to aging, increased sports activities, industrial accidents, and traffic accidents, making them one of the most common fractures encountered in orthopedic practice [1]. In particular, among elderly individuals aged ≥65 years, ankle fractures occur not only due to high-energy trauma (e.g., traffic accidents, falls) but also from low-energy injuries, such as tripping during ambulation [2]. In Finland, which has experienced aging earlier than Korea, the number of ankle fractures in individuals aged 60 years and older increased from 369 cases in 1970 to 1,545 cases in 2000, representing an approximately 319% increase. If this trend continues, it is projected that the incidence of ankle fractures in this population will triple by 2030 [3]. Consequently, evaluating the risk of ankle fractures and establishing prevention strategies have become critical issues. To assess fracture risk, the World Health Organization (WHO) introduced the Fracture Risk Assessment (FRAX) tool, which estimates the 10-year probability of major osteoporotic fractures in individuals aged 40–90 years. The FRAX score considers various clinical factors, including age, sex, body mass index (BMI), previous fractures, bone mineral density (BMD), smoking, alcohol consumption, and underlying diseases. It incorporates epidemiological data from different countries to predict fracture risk, playing a crucial role in osteoporosis prevention and treatment decisions [4].
However, it remains unclear whether ankle fractures occur via the same mechanism as osteoporotic fractures [5]. Osteoporotic fractures typically result from diminished bone mass and structural integrity, often occurring following minimal trauma. These fragility fractures are most commonly observed in the vertebrae, hip, distal radius, and proximal humerus, where the link to low BMD is well established. In contrast, the association between ankle fractures and decreased BMD remains controversial. For example, Stein et al. [6] found no significant difference in BMD between postmenopausal women with and without ankle fractures. Similarly, Therdyothin et al. [7] and Seeley et al. [8] found no meaningful correlation between BMD and ankle fractures in elderly reviews. However, Biver et al. [9] reported lower BMD and altered trabecular structure in women with ankle fractures. Lee et al. [10] also found that elderly patients with ankle fractures had reduced bone attenuation and more complex fracture patterns. These findings suggest that ankle fractures in the elderly may share features with osteoporotic fractures.
Based on this perspective, we aimed to investigate the potential risk factors for ankle fractures in older adults by analyzing the individual components of the FRAX tool. However, due to the retrospective nature of our study and the presence of follow-up loss, we focused on selected FRAX clinical components and comorbidities, rather than the total FRAX score, to assess their potential relevance to ankle fracture risk.
Methods
This study was approved by the Institutional Review Board (IRB) of Chosun University hospital (IRB No. 2024-10-024). Obtainment of informed consent was waived due to the retrospective use of de-identified medical records.
It is a retrospective case-control study. It was described according to the STROBE statement (https://www.strobe-statement.org/).
It was conducted at Chosun University Hospital and Chonnam University Hospital in Gwangju, Korea, from 2020 to 2022.
The case group included 84 patients aged 65 years and older who were diagnosed with an ankle fracture using simple radiographs and computed tomography (CT). The control group comprised 150 patients aged ≥65 years with no history of ankle fractures who underwent BMD testing during their hospital visit. Patients were excluded if they had high-energy trauma, multiple fractures, or prior surgeries affecting dual-energy X-ray absorptiometry (DXA) reliability (Fig. 1). Among the initial participants, eight patients with multiple trauma and five patients with high-energy injuries were excluded from the case group. In the control group, nine patients were excluded due to inaccurate DXA measurements related to prior orthopedic surgeries.
The primary outcome variable is the presence of ankle fracture. The primary predictive variables included age, sex, BMI, previous fracture history, BMD, smoking, alcohol consumption, and underlying diseases (hypertension, diabetes mellitus [type 2 diabetes mellitus in all cases], and dementia). Explanatory variables were BMD at spine, hip neck, total hip.
Data were extracted from the electronic medical records, including X-ray absorptiometry findings. Ankle fractures can be classified based on anatomical location and injury mechanism, which are important for determining treatment strategies. However, our primary goal was to identify relevant risk factors in elderly patients; therefore, detailed classification was not included in the present analysis.
BMD was measured at the spine, total hip, and femoral neck, with the lowest T-score used for osteoporosis status. Each site was analyzed independently to determine site-specific associations (Tables 1, 2). Hypertension, diabetes mellitus, and dementia were classified based on documented prior diagnoses in the medical records.
Prior osteoporosis treatment history and BMD trends were unavailable due to the retrospective design, representing a limitation. We did not compute the FRAX score but analyzed selected FRAX-related clinical variables along with comorbidities such as diabetes mellitus, hypertension, and dementia for exploratory variables.
Sex was classified as male or female; age was grouped as 65–69, 70–79, or ≥80 years. Smoking and alcohol consumption were defined per WHO FRAX criteria. Alcohol intake ≥3 units/day was considered drinking; less was non-drinking. Due to limitations in medical records, alcohol intake was categorized as binary variables, which may not reflect true exposure levels or severity.
BMI was categorized using Korean Society for the Study of Obesity criteria. BMD was classified per WHO criteria: normal (T>–1.0), osteopenia (–1.0 to –2.5), and osteoporosis (T≤–2.5). Previous fracture history was included.
Fall history and functional status were not available from records and could not be included, a key limitation.
Selection bias was minimized by applying strict inclusion and exclusion criteria and enrolling consecutive patients from two tertiary hospitals. Information bias was reduced through standardized DXA protocols and verification of comorbidity diagnoses using electronic medical records. However, due to the retrospective design, unmeasured confounding factors such as fall history, medication use, and functional status may have influenced the results
No a priori sample size calculation was performed because of the retrospective design. Instead, a post hoc power analysis was conducted using the logistic regression module in G*Power.
For diabetes mellitus, the following parameters were applied: two-tailed test, odds ratio of 0.559, baseline risk of 0.322 (57/177), significance level of 0.05, total sample size of 234, R² other X with X of 0.10, binary distribution, and X parameter π of 0.243 (57/234). Under these conditions, the achieved statistical power was 0.318.
For alcohol consumption, the analysis used a two-tailed test, odds ratio of 5.302, baseline risk of 0.400 (80/200), significance level of 0.05, total sample size of 234, R² other X with X of 0.10, binary distribution, and X parameter π of 0.145 (34/234). The achieved statistical power in this model was 0.970.
For Total Hip T-score, two separate post hoc power analyses were performed for osteopenia and osteoporosis compared with normal bone density. For osteopenia versus normal, the analysis used a two-tailed test, odds ratio of 3.260, baseline risk of 0.400 (60/150), significance level of 0.05, total sample size of 234, R² other X with X of 0.10, binary distribution, and X parameter π of 0.517 (121/234). Under these conditions, the achieved statistical power was 0.752. For osteoporosis versus normal, the analysis used a two-tailed test, odds ratio of 3.561, baseline risk of 0.240 (19/79), significance level of 0.05, total sample size of 234, R² other X with X of 0.10, binary distribution, and X parameter π of 0.094 (22/234). The achieved statistical power in this model was 0.662.
This study did not employ case-control matching based on age, sex, or BMI due to a limited sample size (n=234). Instead, logistic regression analysis was used to adjust for these variables statistically. Analyses were performed using IBM SPSS ver. 27.0 (IBM Corp.). The chi-square test was used for group comparisons; Fisher exact test was applied when appropriate. Variables with P<0.1 in univariate analysis were included in the logistic regression model and results with P<0.05 were considered statistically significant. Model fit was assessed using the Hosmer-Lemeshow test (P=0.377), indicating adequate calibration.
Results
A total of 234 participants were included in the final analysis, consisting of 84 patients in the ankle fracture group and 150 in the control group. Tables 1 and 2 each summarizes baseline characteristics and BMD characteristics. There were no significant differences between groups in age, sex, or BMI category.
Univariate analysis (Table 2) revealed no significant associations between ankle fracture occurrence and sex (P=0.447), age (P=0.676), BMI (P=0.538), hypertension (P=0.742), dementia (P=0.590), smoking (P=0.682), or prior fracture history (P=0.164).
However, diabetes mellitus was significantly associated with ankle fracture occurrence (P=0.038). Alcohol consumption also showed a significant association (P=0.001) (Table 3). In terms of BMD, there were no significant differences in overall mean BMD, spine T-score, or hip neck T-score. However, total hip T-score categories were significantly associated with fracture incidence (P=0.040), with a higher frequency of osteoporosis in the fracture group (Table 4).
Binary logistic regression analysis was performed including variables with P<0.1 from the univariate analysis (Table 5). Alcohol consumption remained a significant independent risk factor for ankle fracture, with non-drinkers as the reference group (OR, 5.302; 95% CI, 1.778–15.811; P=0.003).
Total hip osteopenia (T-score between –1.0 and –2.5) and osteoporosis (T-score≤–2.5) were independently associated with increased fracture risk compared to individuals with normal BMD (T-score>–1.0), the reference group. The odds ratio for osteopenia was 3.260 (95% CI, 1.003–10.598; P=0.049) and for osteoporosis was 3.561 (95% CI, 1.127–11.255; P=0.031).
The association with diabetes mellitus did not reach statistical significance (OR, 0.559; 95% CI, 0.295–1.058; P=0.074), with individuals without diabetes mellitus as the reference group. Although this result suggests a lower risk of ankle fracture in the diabetes group, the finding should be interpreted with caution given the borderline P-value.
Model fit was assessed using the Hosmer-Lemeshow goodness-of-fit test, which showed no evidence of poor fit (P=0.377), indicating that the model adequately described the data. Additionally, based on power analysis (OR, 1.9; α, 0.05; power, 0.95), a minimum of 171 participants was required. With 234 subjects included, the study achieved an actual power of 0.95, confirming sufficient statistical power.
Discussion
Among 234 older adults (84 cases, 150 controls), logistic regression identified alcohol consumption and reduced total hip BMD as independent risk factors for ankle fractures. Alcohol use increased fracture risk more than fivefold (OR, 5.302; 95% confidence interval [CI], 1.778–15.811; P=0.003). Both osteopenia (OR, 3.260; P=0.049) and osteoporosis (OR, 3.561; P=0.031) at the total hip were significantly associated with ankle fractures, whereas diabetes mellitus showed only borderline significance (P=0.074).
Moayeri et al. [11] conducted a meta-analysis of 30 studies and found increased fracture risk in patients with type 2 diabetes mellitus, though not at the ankle. Wang et al. [12] later found a significant association between diabetes and ankle fractures. However, few studies have specifically examined this relationship in elderly individuals, supporting its inclusion here.
Du et al. [13] demonstrated that hypertension was associated with increased future fracture risk, and Li et al. [14] confirmed a higher risk of osteoporotic fractures in hypertensive individuals. Still, limited research exists on ankle fractures specifically, particularly in the elderly.
Dementia was included due to its known link to fall risk. Dumurgier and Tzourio [15] found dementia to be the most prevalent neurological condition in older adults. Phelan et al. [16] and Simpkins et al. [17] both showed that fall incidence increases in individuals with Alzheimer’s disease, the most prevalent type of dementia. Liu et al. [18] reported that over three-quarters of ankle fractures in the elderly resulted from low-energy trauma, highlighting the relevance of fall-related conditions. Based on these considerations, hypertension, diabetes mellitus, and dementia were included as variables in this study.
Interestingly, while several components such as age, sex, BMI, prior fractures, and BMD variables other than total hip T-score were not consistently associated with ankle fracture occurrence, certain findings, including alcohol consumption, total hip T-score, and diabetes mellitus status, were found to be associated with ankle fractures in the elderly, but should be interpreted with caution.
In our study, alcohol consumption was significantly associated with an increased risk of ankle fractures. Specifically, individuals who reported alcohol consumption had a 5.302-fold higher risk of ankle fractures compared to non-drinkers (OR, 5.302; 95% CI, 1.778–15.811; P=0.003). This finding is consistent with previous research investigating alcohol-related injuries to the foot and ankle. Pirruccio and Farber [19] reported that alcohol use is mechanistically linked to traumatic foot and ankle fractures through increased incidence of falls, particularly in emergency department visits across the United States. Alcohol consumption has been repeatedly associated with increased fall risk in older adults, primarily due to its effects on sensorium, balance, and concentration, which are further exacerbated by age-related physiological decline [19]. In a nationwide longitudinal study by Wang et al. [20], the authors reported that the pattern of association between alcohol consumption and fracture risk varies depending on the anatomical site. Specifically, vertebral fractures demonstrated a J-shaped association with alcohol intake. Mild to moderate drinking was associated with reduced risk, while excessive intake increased the risk. In contrast, limb fractures, including ankle fractures, showed a dose-dependent linear increase in fracture risk with increasing alcohol consumption. Taken together, our findings suggest that alcohol consumption may contribute to an increased risk of ankle fractures, potentially through mechanisms involving fall susceptibility and alcohol-induced alterations in neuromuscular coordination or bone integrity. However, due to the observational nature of the study and the presence of multiple confounding factors—including physical frailty, comorbidities, and lifestyle behaviors, alcohol consumption should be interpreted with caution and may not be considered an independent risk factor with certainty. Further prospective studies with more precise measurement of alcohol exposure are needed to clarify this relationship.
Next, both osteopenia and osteoporosis, as defined by total hip T-score, were significantly associated with an increased risk of ankle fractures compared to individuals with normal total hip T-score group. Specifically, the risk of ankle fracture was 3.26 times higher in the osteopenia group (OR, 3.260; 95% CI, 1.003–10.598) and 3.56 times higher in the osteoporosis group (OR, 3.561; 95% CI, 1.127–11.255). Cummings and Melton [21] reported that, in addition to the presence of low BMD itself, the anatomical site of BMD measurement may influence its predictive value for fracture risk. In particular, BMD at the proximal femur provides better predictive accuracy for overall fracture risk than spinal measurements, likely due to fewer degenerative artifacts and greater measurement reliability at the hip.
A cohort study by Leslie et al. [22] further explored this issue by examining the clinical implications of discordance between total hip and femoral neck T-scores. They suggested that the total hip T-score may better reflect susceptibility to osteoporotic fractures compared to the femoral neck. For example, individuals whose total hip T-score was at least one unit lower than their femoral neck T-score had significantly higher risks of major osteoporotic fractures.
They proposed that although hip sites are highly correlated, there are different proportions of cortical and trabecular bone, which may contribute differently to bone strength across the skeleton. Furthermore, femoral neck is more prone to measurement artifacts due to osteoarthritic changes such as medial buttressing, especially in older individuals. In our study, total hip T-score–based classifications of osteopenia and osteoporosis were both independently associated with increased ankle fracture risk, suggesting that lower total hip BMD may contribute to susceptibility to ankle fractures. Nevertheless, this interpretation must be approached with caution. In a recent systematic review and meta-analysis, So et al. [23] reported that elderly patients with ankle fractures had significantly lower femoral neck BMD compared to those without fractures. However, this relationship remains controversial and is not yet fully established [7]. Also, due to the retrospective design of our study and lack of information, we were unable to account for potential confounding factors such as prior use of osteoporosis medications, adherence to treatment, or longitudinal changes in BMD over time. Additionally, Shevroja et al. [24] argued that DXA-derived T-scores do not account for other important aspects of bone health, such as microarchitecture, bone turnover, or mineralization. They further noted that unmeasured factors, including fall history, balance, muscle strength, and physical function, may also play a significant role in fracture occurrence [24]. Therefore, while our findings suggest that total hip T-score is a potentially valuable indicator of ankle fracture risk in the elderly. Although earlier studies have reported no association between total hip T score and ankle fractures, our findings suggest that total hip T-score may still provide valuable predictive information. However, further prospective studies incorporating treatment history, bone quality parameters, and functional risk factors are warranted to validate this association.
Next, diabetes mellitus variant was associated with a lower risk of ankle fracture, although the association did not reach statistical significance (P=0.074). This finding contrasts with prior studies, which have consistently reported diabetes mellitus as a risk factor for fractures, attributed to factors such as impaired bone quality, microvascular complications, neuropathy, and increased fall risk [25]. Given that the observed inverse association may be influenced by unmeasured or residual confounders, and considering that the P-value falls below the conventional threshold of 0.10 but not 0.05, this variable should not be disregarded. According to statistical recommendations, variables with P-values below 0.10 in univariate analyses are often retained in multivariable models to control for potential confounding. Therefore, the inverse association observed in our study may not reflect a true protective effect, but rather a result of confounding or sample-specific variation such as treatment confounding and healthy user bias.
We were unable to assess fall history, functional status, or osteoporosis treatment adherence, which are important confounders in fracture risk assessment.
In conclusion, our findings suggest that certain FRAX score components—such as alcohol consumption—may contribute to ankle fracture risk. Moreover, unlike the conventional FRAX model, which is based solely on the femoral neck T-score, our results indicate that the total hip T-score may also have meaningful relevance in assessing this risk. Notably, the current FRAX tool estimates the 10-year probability of major osteoporotic fractures based on a composite risk score incorporating clinical variables and femoral neck BMD. Several FRAX components—including prior glucocorticoid use and secondary osteoporosis—could not be assessed in our study. Future prospective studies incorporating longitudinal BMD data, treatment history, and functional risk factors are warranted to confirm these findings and facilitate the development of an ankle fracture–specific risk prediction model.
-
Author contribution
Conceptualization: MJS, JYL. Data curation: MJS, SWJ, SJP. Formal analysis: SWJ, JYL. Methodology: SWJ, SJP. Project administration: JYL. Funding: JYL. Investigation: MJS. Supervision: JYL. Writing-original draft: MJS,SJP. Writing-review & editing: MJS, SWJ, JYL. All authors read and approved the final manuscript.
-
Conflict of interests
No potential conflict of interest relevant to this article was reported.
-
Funding
This study was supported by research fund from Chosun University Hospital 2023.
-
Data availability
Contact the corresponding author for data availability.
-
Acknowledgments
None.
-
Supplementary materials
None.
Article Information
Fig. 1.

Flowchart depicting the participant selection process for inclusion in the study. Participants were selected from two hospitals between January 2020 and December 2022, with exclusion criteria applied based on age, data completeness, and eligibility for bone mineral density testing. BMD, bone mineral density; DXA, dual-energy X-ray absorptiometry.
Table 1.
Demographics of participants (n=234)
Table 2.
Bone mineral density characteristics of participants
Table 3.
Presence of ankle fractures according to participants' characteristics
Table 4.
Presence of ankle fractures according to participants’ BMD
Table 5.
Logistic regression for ankle fracture risk (n=234)
Results of logistic regression analysis identifying independent factors associated with ankle fractures. Odds ratios (ORs) and 95% confidence intervals (CIs) are shown. Reference groups: diabetes-negative, non-drinkers, and participants with normal total hip T-score. A P-value of <0.05 was considered statistically significant. Model fit was confirmed using the Hosmer-Lemeshow test (P=0.377).
- 1. Kang HJ, Lee JW, Kwon YM, Kim SJ. Epidemiology of ankle fractures in Korea: a nationwide population-based study. J Korean Med Sci 2022;37:e288. ArticlePubMedPMCPDF
- 2. Scheer RC, Newman JM, Zhou JJ, et al. Ankle fracture epidemiology in the United States: patient-related trends and mechanisms of injury. J Foot Ankle Surg 2020;59:479-83.ArticlePubMed
- 3. Duckworth AD, Clement ND, Aitken SA, Court-Brown CM, McQueen MM. The epidemiology of fractures of the proximal ulna. Injury 2012;43:343-6.ArticlePubMed
- 4. Rommens PM, Küchle R, Schneider RU, Reuter M. Olecranon fractures in adults: factors influencing outcome. Injury 2004;35:1149-57.ArticlePubMed
- 5. Wiegand L, Bernstein J, Ahn J. Fractures in brief: olecranon fractures. Clin Orthop Relat Res 2012;470:3637-41.ArticlePubMedPMC
- 6. Stein EM, Liu SX, Nickolas TL, et al. abnormal microarchitecture and stiffness in postmenopausal women with ankle fractures. J Clin Endocrinol Metab 2011;96:2041-8.ArticlePubMedPMC
- 7. Therdyothin A, Phiphopthatsanee N, Wajanavisit W, et al. Is ankle fracture related to low bone mineral density and subsequent fracture? A systematic review. Osteoporos Sarcopenia 2020;6:151-9.Article
- 8. Seeley DG, Browner WS, Nevitt MC, Genant HK, Scott JC, Cummings SR. Which fractures are associated with low appendicular bone mass in elderly women?: the study of osteoporotic fractures research group. Ann Intern Med 1991;115:837-42.
- 9. Biver E, Durosier-Izart C, Chevalley T, van Rietbergen B, Rizzoli R, Ferrari S. Evaluation of radius microstructure and areal bone mineral density improves fracture prediction in postmenopausal women. J Bone Miner Res 2018;33:328-37.ArticlePubMedPDF
- 10. Lee KM, Chung CY, Kwon SS, et al. Ankle fractures have features of an osteoporotic fracture. Osteoporos Int 2013;24:2819-25.ArticlePubMedPDF
- 11. Moayeri A, Mohamadpour M, Mousavi SF, Shirzadpour E, Mohamadpour S, Amraei M. Fracture risk in patients with type 2 diabetes mellitus and possible risk factors: a systematic review and meta-analysis. Ther Clin Risk Manag 2017;13:455-68.ArticlePDF
- 12. Wang H, Ba Y, Xing Q, Du JL. Diabetes mellitus and the risk of fractures at specific sites: a meta-analysis. BMJ Open 2019;9:e024067. ArticlePubMedPMC
- 13. Du XP, Zheng ML, Yang XC, Zheng ML. High blood pressure is associated with increased risk of future fracture, but not vice versa. Sci Rep 2024;14:8005.ArticlePubMedPMCPDF
- 14. Li C, Zeng Y, Tao L, Liu S, Ni Z, Huang Q, Wang Q. Meta-analysis of hypertension and osteoporotic fracture risk in women and men. Osteoporos Int 2017;28:2309-18.ArticlePubMedPDF
- 15. Dumurgier J, Tzourio C. Epidemiology of neurological diseases in older adults. Rev Neurol (Paris) 2020;176:642-8.Article
- 16. Phelan EA, Mahoney JE, Voit JC, Stevens JA. Assessment and management of fall risk in primary care settings. Med Clin North Am 2015;99:281-93.ArticlePubMedPMC
- 17. Simpkins C, Khalili SM, Yang F. Meta-analysis-based comparison of annual fall risk between older adults with Alzheimer's disease and mild cognitive impairment. Adv Geriatr Med Res 2024;6:e240002. PubMedPMC
- 18. Liu S, Zhu Y, Chen W, Wang L, Zhang X, Zhang Y. Demographic and socioeconomic factors influencing the incidence of ankle fractures, a national population-based survey of 512187 individuals. Sci Rep 2018;8:10443.ArticlePubMedPMCPDF
- 19. Pirruccio K, Farber DC. Rising burden of alcohol-associated foot and ankle fractures presenting to U.S. Emergency Departments: 2000-2017. Foot Ankle Orthop 2019;4:2473011419S00341.ArticlePMCPDF
- 20. Wang SM, Han KD, Kim NY, et al. Association of alcohol intake and fracture risk in elderly varied by affected bones: a nationwide longitudinal study. Psychiatry Investig 2020;17:1013-20.ArticlePubMedPMCPDF
- 21. Cummings SR, Melton LJ. Epidemiology and outcomes of osteoporotic fractures. Lancet 2002;359:1761-7.ArticlePubMed
- 22. Leslie WD, Morin SN, Lix LM, et al. Effect of discordant hip bone density on incident fracture risk: a registry-based cohort study. J Bone Miner Res 2022;37:2018-24.
- 23. So E, Rushing CJ, Simon JE, Goss DA, Prissel MA, Berlet GC. Association between bone mineral density and elderly ankle fractures: a systematic review and meta-analysis. J Foot Ankle Surg 2020;59:1049-57.Article
- 24. Shevroja E, Cafarelli FP, Guglielmi G, Hans D. DXA parameters, Trabecular Bone Score (TBS) and Bone Mineral Density (BMD), in fracture risk prediction in endocrine-mediated secondary osteoporosis. Endocrine 2021;74:20-8.ArticlePubMedPMCPDF
- 25. Siris ES, Miller PD, Barrett-Connor E, et al. Identification and fracture outcomes of undiagnosed low bone mineral density in postmenopausal women: results from the National Osteoporosis Risk Assessment. JAMA 2001;286:2815-22.Article
References
Figure & Data
REFERENCES
Citations
Citations to this article as recorded by 
 ePub Link
 Cite
CiteRisk factors for ankle fractures in older adults based on clinical components of the Fracture Risk Assessment (FRAX) tool and comorbidities in Korea: a retrospective case-control study
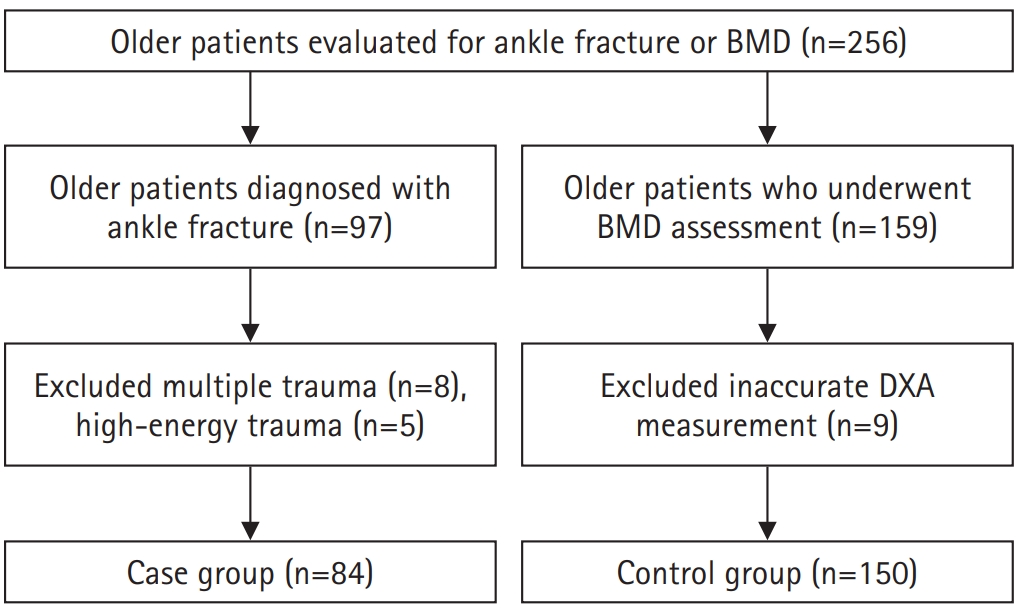
Fig. 1. Flowchart depicting the participant selection process for inclusion in the study. Participants were selected from two hospitals between January 2020 and December 2022, with exclusion criteria applied based on age, data completeness, and eligibility for bone mineral density testing. BMD, bone mineral density; DXA, dual-energy X-ray absorptiometry.
Fig. 1.
Risk factors for ankle fractures in older adults based on clinical components of the Fracture Risk Assessment (FRAX) tool and comorbidities in Korea: a retrospective case-control study
| Variable | Value |
|---|---|
| Sex | |
| Male | 79 (33.8) |
| Female | 155 (66.2) |
| Age (yr) | 72.32±5.79 |
| ≤69 | 89 (38.0) |
| 70‒79 | 114 (48.7) |
| ≥80 | 31 (13.2) |
| Underlying diseases (negative:positive) | |
| Diabetes mellitus | 177 (75.6):57 (24.4) |
| Hypertension | 112 (47.9):122 (52.1) |
| Dementia | 229 (97.9):5 (2.1) |
| Health behaviors (absent:present) | |
| Smoking | 215 (91.9):19 (8.1) |
| Alcohol consumption | 200 (85.5):34 (14.5) |
| Body mass index (kg/m2) | 24.93±3.27 |
| Underweight (<18.5) | 4 (1.7) |
| Normal weight (18.5–22.9) | 59 (25.2) |
| Overweight (23.0–24.9) | 62 (26.5) |
| Obesity (25.0–29.9) | 94 (40.2) |
| Severe obesity (≥30.0) | 15 (6.4) |
| Previous fracture history | |
| Absent | 202 (86.3) |
| Present | 32 (13.7) |
| Variable | Value |
|---|---|
| Bone mineral density | ‒2.28±1.03 |
| Normal | 24 (10.3) |
| Osteopenia | 104 (44.4) |
| Osteoporosis | 106 (45.3) |
| Spine T score | ‒1.75±1.46 |
| Normal | 63 (26.9) |
| Osteopenia | 92 (39.3) |
| Osteoporosis | 79 (33.8) |
| Hip neck T score | ‒1.84±0.95 |
| Normal | 39 (16.7) |
| Osteopenia | 131 (56.0) |
| Osteoporosis | 64 (27.4) |
| Total hip T score | ‒1.22±0.96 |
| Normal | 91 (38.9) |
| Osteopenia | 121 (51.7) |
| Osteoporosis | 22 (9.4) |
| Category | With ankle fracture | Without ankle fracture | χ2 or t | P-value |
|---|---|---|---|---|
| Sex | 0.579 | 0.447 | ||
| Male | 31 (36.9) | 48 (32.0) | ||
| Female | 53 (63.1) | 102 (68.0) | ||
| Age (yr) | 71.64±5.67 | 72.71±5.84 | 1.350 | 0.178 |
| ≤69 | 35 (41.7) | 54 (36.0) | 0.783 | 0.676 |
| 70–79 | 28 (45.2) | 76 (50.7) | ||
| ≥80 | 11 (13.1) | 20 (13.3) | ||
| Underlying diseases | ||||
| Diabetes mellitus | 4.309 | 0.038 | ||
| Negative | 57 (67.9) | 120 (80.0) | ||
| Positive | 27 (32.1) | 30 (20.0) | ||
| Hypertension | 0.108 | 0.742 | ||
| Negative | 39 (46.4) | 73 (48.7) | ||
| Positive | 45 (53.6) | 77 (51.3) | ||
| Dementia | 0.037 | 0.590 | ||
| Negative | 82 (97.6) | 147 (98.0) | ||
| Positive | 2 (2.4) | 3 (2.0) | ||
| Health behavior | ||||
| Smoking | 0.168 | 0.682 | ||
| Absent | 78 (92.9) | 137 (91.3) | ||
| Present | 6 (7.1) | 13 (8.7) | ||
| Alcohol consumption | 10.068 | 0.001 | ||
| Absent | 80 (95.2) | 120 (80.0) | ||
| Present | 4 (4.8) | 30 (20.0) | ||
| Body mass index (kg/m2) | 24.87±3.22 | 24.97±3.31 | 0.228 | 0.820 |
| Underweight (<18.5) | 0 | 4 (2.7) | 3.117 | 0.538 |
| Normal weight (18.5–22.9) | 23 (27.4) | 36 (24.0) | ||
| Overweight (23.0–24.9) | 22 (26.2) | 40 (26.7) | ||
| Obesity (25.0–29.9) | 35 (41.7) | 59 (39.3) | ||
| Severe obesity (≥30.0) | 4 (4.8) | 11 (7.3) | ||
| Previous fracture history | 1.941 | 0.164 | ||
| Absent | 69 (82.1) | 133 (88.7) | ||
| Present | 15 (17.9) | 17 (11.3) |
| Variable | With ankle fracture | Without ankle fracture | χ² or t | P-value |
|---|---|---|---|---|
| BMD | ‒2.34±0.99 | ‒2.23±1.05 | 0.810 | 0.419 |
| Normal | 9 (10.7) | 15 (10.0) | 3.154 | 0.207 |
| Osteopenia | 31 (36.9) | 73 (48.7) | ||
| Osteoporosis | 44 (52.4) | 62 (41.3) | ||
| Spine T score | ‒1.90±1.41 | ‒1.66±1.49 | 1.205 | 0.229 |
| Normal | 19 (22.6) | 44 (29.3) | 3.76 | 0.153 |
| Osteopenia | 30 (35.7) | 62 (41.3) | ||
| Osteoporosis | 35 (41.7) | 44 (29.3) | ||
| Hip neck T score | ‒1.79±0.95 | ‒1.87±0.95 | 0.619 | 0.537 |
| Normal | 19 (22.6) | 20 (13.3) | 4.062 | 0.131 |
| Osteopenia | 41 (48.8) | 90 (60.0) | ||
| Osteoporosis | 24 (28.6) | 40 (26.7) | ||
| Total hip T score | ‒1.16±0.94 | ‒1.26±0.99 | 0.721 | 0.471 |
| Normal | 31 (36.9) | 60 (40.0) | 6.418 | 0.040 |
| Osteopenia | 50 (59.5) | 71 (47.3) | ||
| Osteoporosis | 3 (3.6) | 19 (12.7) |
| Variable | Category | B | SE | P-value | OR | 95% CI |
|---|---|---|---|---|---|---|
| Underlying diseases | Diabetes mellitus (vs. negative) | ‒0.582 | 0.326 | 0.074 | 0.559 | 0.295‒1.058 |
| Health behavior | Alcohol consumption (vs. non-drinker) | 1.688 | 0.557 | 0.003 | 5.302 | 1.778‒15.811 |
| Total hip T score | Normal | - | - | 0.095 | - | - |
| Osteopenia (vs. normal) | 1.182 | 0.601 | 0.049 | 3.260 | 1.003‒10.598 | |
| Osteoporosis (vs. normal) | 1.270 | 0.587 | 0.031 | 3.561 | 1.127‒11.255 |
Table 1. Demographics of participants (n=234)
Values are presented as number (%) or mean±standard deviation.
Table 2. Bone mineral density characteristics of participants
Bone mineral density distribution of participants according to measurement site. Values are presented as number (%) or mean±standard deviation. T-scores were classified into normal, osteopenia, and osteoporosis based on the World Health Organization criteria.
Table 3. Presence of ankle fractures according to participants' characteristics
Comparison of demographic and clinical characteristics between participants with and without ankle fractures. Values are presented as number (%) or mean±standard deviation. The Fisher exact test was used when expected cell counts were less than 5.
Table 4. Presence of ankle fractures according to participants’ BMD
Distribution of ankle fractures according to bone mineral density (BMD) status by measurement site. Values are presented as mean±standard deviation or number (%). Statistical analysis was performed using the chi-square test or the Fisher exact test when appropriate.
Table 5. Logistic regression for ankle fracture risk (n=234)
Results of logistic regression analysis identifying independent factors associated with ankle fractures. Odds ratios (ORs) and 95% confidence intervals (CIs) are shown. Reference groups: diabetes-negative, non-drinkers, and participants with normal total hip T-score. A P-value of <0.05 was considered statistically significant. Model fit was confirmed using the Hosmer-Lemeshow test (P=0.377).

