 E-submission
 TOTA
TOTA TOTS
TOTS
Articles
- Page Path
- HOME > J Musculoskelet Trauma > Volume 23(1); 2010 > Article
-
Original Article
- A Finite Element Analysis of Biomechanical Stability of Compression Plate Fixation System in according to Existing of Fracture Gap after Bone Fracture Augmentation
- Duk-Young Jung, Ph.D., Bong-Ju Kim, Ph.D., Jong-Keon Oh, M.D.
-
Journal of the Korean Fracture Society 2010;23(1):83-89.
DOI: https://doi.org/10.12671/jkfs.2010.23.1.83
Published online: January 31, 2010
*Senior Products Industrial Center, Busan Techno-park, Korea.
†AK Project, Graduate School of Medicine, Kyoto University, Kyoto, Japan.
‡Department of Orthopedic Surgery, Korea University College of Medcine, Seoul, Korea.
- Address reprint requests to: Jong-Keon Oh, M.D. Department of Orthopedic Surgery, Korea University College of Medcine, 80, Guro-dong, Guro-gu, Seoul 152-703, Korea. Tel: 82-2-2626-3088, Fax: 82-2-2626-1164, jkoh@korea.ac.kr
• Received: October 7, 2009 • Accepted: November 9, 2009
Copyright © 2010 The Korean Fracture Society
- 1,124 Views
- 3 Download
- 1 Crossref
Abstract
-
Purpose
- This study using the finite element analysis (FEA) focused on evaluating the biomechanical stability of the LC-DCP in accordance with existing of the fracture gap at the facture site after bone fracture augmentation.
-
Materials and Methods
- For FEM analysis, total eleven types with different fracture models considering clinical fracture cases were constructed according to the fracture gap sizes (0, 1, 4 mm)/widths (0, 25, 50, 75, 100%). Limited contact dynamic compression plate (LC-DCP) fixation system was used in this FEM analysis, and three types of load were applied to the bone-plate fixation system: compressive, torsional, bending load.
-
Results
- The results in FEM analysis showed that the 1, 4 mm fracture gap sizes and 75% or more fracture gap widths increased considerably the peak von Mises stress (PVMS) both the plate and the screw under all loading conditions. PVMS were concentrated on the center of the LC-DCP bone-plate, and around the necks of screws.
-
Conclusion
- Based on the our findings, we recommend at least 50% contact of the fracture faces in a fracture surgery using the compression bone-plate system. Moreover, if x-ray observation after surgery finds 100% fracture gap or 50% or more fracture gap width, supplementary measures to improve biomechanical stability must be taken, such as restriction of walking of the patient or plastering.
- 1. Baumgaertel F, Buhl M, Rahn BA. Fracture healing in biological plate osteosynthesis. Injury, 1998;29:Suppl 3. C3-C6.Article
- 2. Cordey J, Borgeaud M, Perren SM. Force transfer between the plate and the bone: relative importance of the bending stiffness of the screws and the friction between plate and bone. Injury, 2000;31:Suppl 3. C21-C28.Article
- 3. Cordey J, Perren SM, Steinemann SG. Stress protection due to plates: myth or reality? A parametric analysis made using the composite beam theory. Injury, 2000;31:Suppl 3. C1-C13.Article
- 4. Ferguson SJ, Wyss UP, Pichora DR. Finite element stress analysis of a hybrid fracture fixation plate. Med Eng Phys, 1996;18:241-250.ArticlePDF
- 5. Gardner MJ, Brophy RH, Campbell D, et al. The mechanical behavior of locking compression plates compared with dynamic compression plates in a cadaver radius model. J Orthop Trauma, 2005;19:597-603.Article
- 6. Gautier E, Perren SM, Cordey J. Effect of plate position relative to bending direction on the rigidity of a plate ostosynthesis. A theoretical analysis. Injury, 2000;31:Suppl 3. C14-C20.
- 7. Korner J, Diederichs G, Arzdorf M, et al. A biomechanical evaluation of methods of distal humerus fracture fixation using locking compression plate versus conventional reconstruction plates. J Orthop Trauma, 2004;18:286-293.
- 8. Kowalski MJ, Schemitsch EH, Harringston RM, Chapman JR, Swionthowski MF. A comparative biomechanical evaluation of a noncontacting plate and currently used devices for tibial fixation. J Trauma, 1996;40:5-9.Article
- 9. Fulkerson E, Egol KA, Kubiak EN, Liporace F, Kummer FJ, Koval KJ. Fixation of diaphyseal fractures with segmental defects: a biomechanical comparison of locked and conventional plating techniques. J Trauma, 2006;60:830-835.
- 10. Perren SM. Evolution of the internal fixation of long bone fracture. The scientific basis of biological internal fixation: choosing a new balance between stability and biology. J Bone Joint Surg Br, 2002;84:1093-1110.
- 11. Perren SM. The concept of biological plating using the limited contact-dynamic compression plate (LC-DCP) Scientific background, design and application. Injury, 1991;22:Suppl 1. 1-41.Article
- 12. Ramakrishna K, Shidhar I, Sivashanker S, Khong KS, Chista DN. Design of fracture fixation plate for necessary and sufficient bone stress shielding. JSME Int J Ser C, 2004;47:1086-1094.
- 13. Sommer C, Gautier E, Müller M, Helfet DL, Wagner M. First clinical results of the locking compression plate (LCP). Injury, 2003;34:Suppl 2. B43-B54.
- 14. Stoffel K, Dieter U, Stachowiak G, Gächter A, Kuster MS. Biomechanical testing of the LCP - how can stability in locked internal fixators be controlled? Injury, 2003;34:Suppl 2. B11-B19.
- 15. Stoffel K, Stachowiak G, Forster T, Gächter A, Kuster M. Oblique screws at the plate ends increase the fixation strength in synthetic bone test medium. J Orthop Trauma, 2004;18:611-616.
- 16. Törnkvist H, Hearn TC, Schatzker J. The strength of plate fixation in relation to the number and spacing of bone screws. J Orthop Trauma, 1996;10:204-208.
- 17. Veerabagu S, Fujihara K, Dasari GR, Ramakrishna S. Strain distribution analysis of braided composite bone plates. Compos Sci Technol, 2003;62:427-435.
REFERENCES
Fig. 1Bone fracture augmentations with compressing plate (A), the arrow indicates the fracture gap at the bone fracture site (B), and the arrow indicates callus formation around the bone fracture site (C).

Fig. 2Test specimen with LC-DCP fixation system for validating the 3-D FEM model (A), the bone-plate fixation system 3-D FEM model (B), and the fracture gap sizes and widths (C).
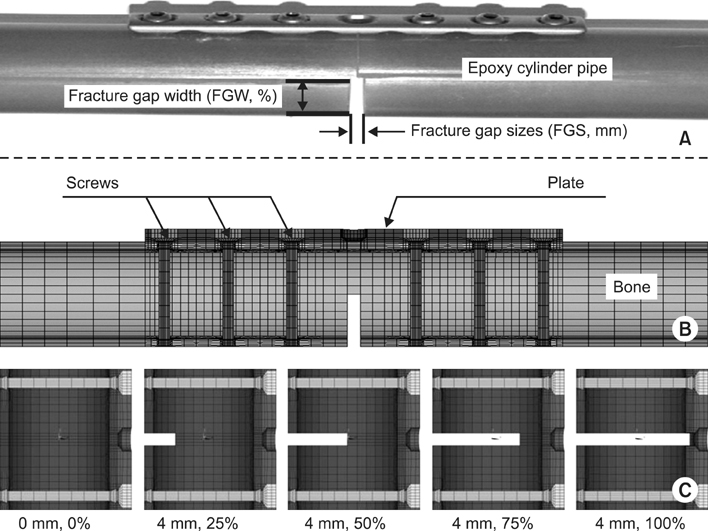
Fig. 3Von Mises stress distributions and levels on the screws (A) and the plates (B) according to the changes of the fracture gap size and fracture gap width under compressive load.

Fig. 4Comparisons of peak von Mises stress (PVMS) according to the change of fracture gap size and width under the compressive load.

Fig. 5Comparisons of peak von Mises stress (PVMS) according to the change of fracture gap size and width under the torsional load.
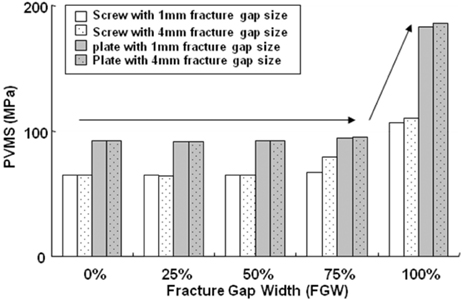
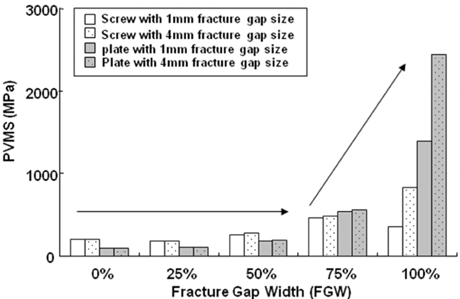
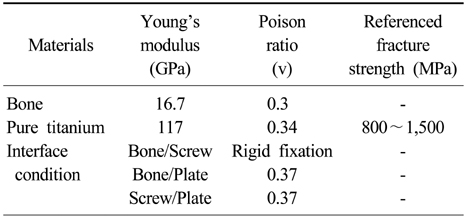
Figure & Data
REFERENCES
Citations
Citations to this article as recorded by 
- Application of Patient-Specific 3D-Printed Orthopedic Splint for Bone Fracture in Small Breed Dogs
Kwangsik Jang, Eun Joo Jang, Yo Han Min, Kyung Mi Shim, Chunsik Bae, Seong Soo Kang, Se Eun Kim
Journal of Veterinary Clinics.2023; 40(4): 268. CrossRef
 Cite
CiteA Finite Element Analysis of Biomechanical Stability of Compression Plate Fixation System in according to Existing of Fracture Gap after Bone Fracture Augmentation
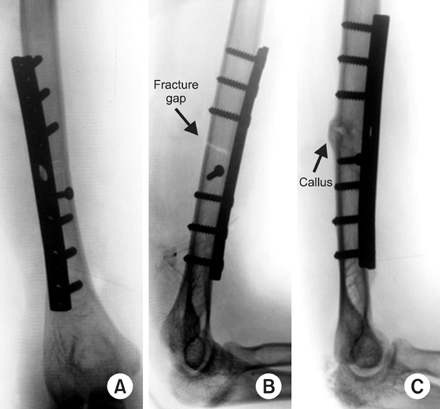

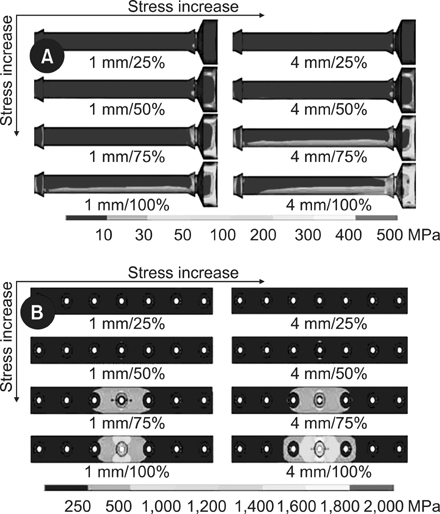
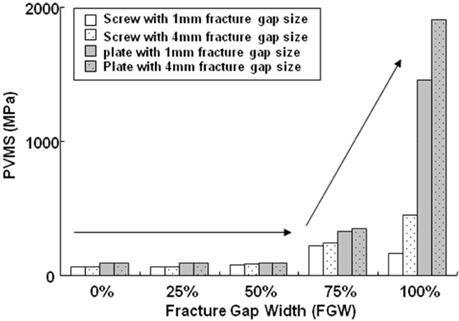


Fig. 1
Bone fracture augmentations with compressing plate (A), the arrow indicates the fracture gap at the bone fracture site (B), and the arrow indicates callus formation around the bone fracture site (C).
Fig. 2
Test specimen with LC-DCP fixation system for validating the 3-D FEM model (A), the bone-plate fixation system 3-D FEM model (B), and the fracture gap sizes and widths (C).
Fig. 3
Von Mises stress distributions and levels on the screws (A) and the plates (B) according to the changes of the fracture gap size and fracture gap width under compressive load.
Fig. 4
Comparisons of peak von Mises stress (PVMS) according to the change of fracture gap size and width under the compressive load.
Fig. 5
Comparisons of peak von Mises stress (PVMS) according to the change of fracture gap size and width under the torsional load.
Fig. 6
Comparisons of peak von Mises stress (PVMS) according to the change of fracture gap size and width under the 4-point bending load.
Fig. 1
Fig. 2
Fig. 3
Fig. 4
Fig. 5
Fig. 6
A Finite Element Analysis of Biomechanical Stability of Compression Plate Fixation System in according to Existing of Fracture Gap after Bone Fracture Augmentation
Mechanical properties and component interface conditions assigned to FEA models
Table 1
Mechanical properties and component interface conditions assigned to FEA models

